On the section chart reports we could create a dynamic chart that works against user defined custom fields (single and multiple select drop-downs) showing a pie chart with the distribution.
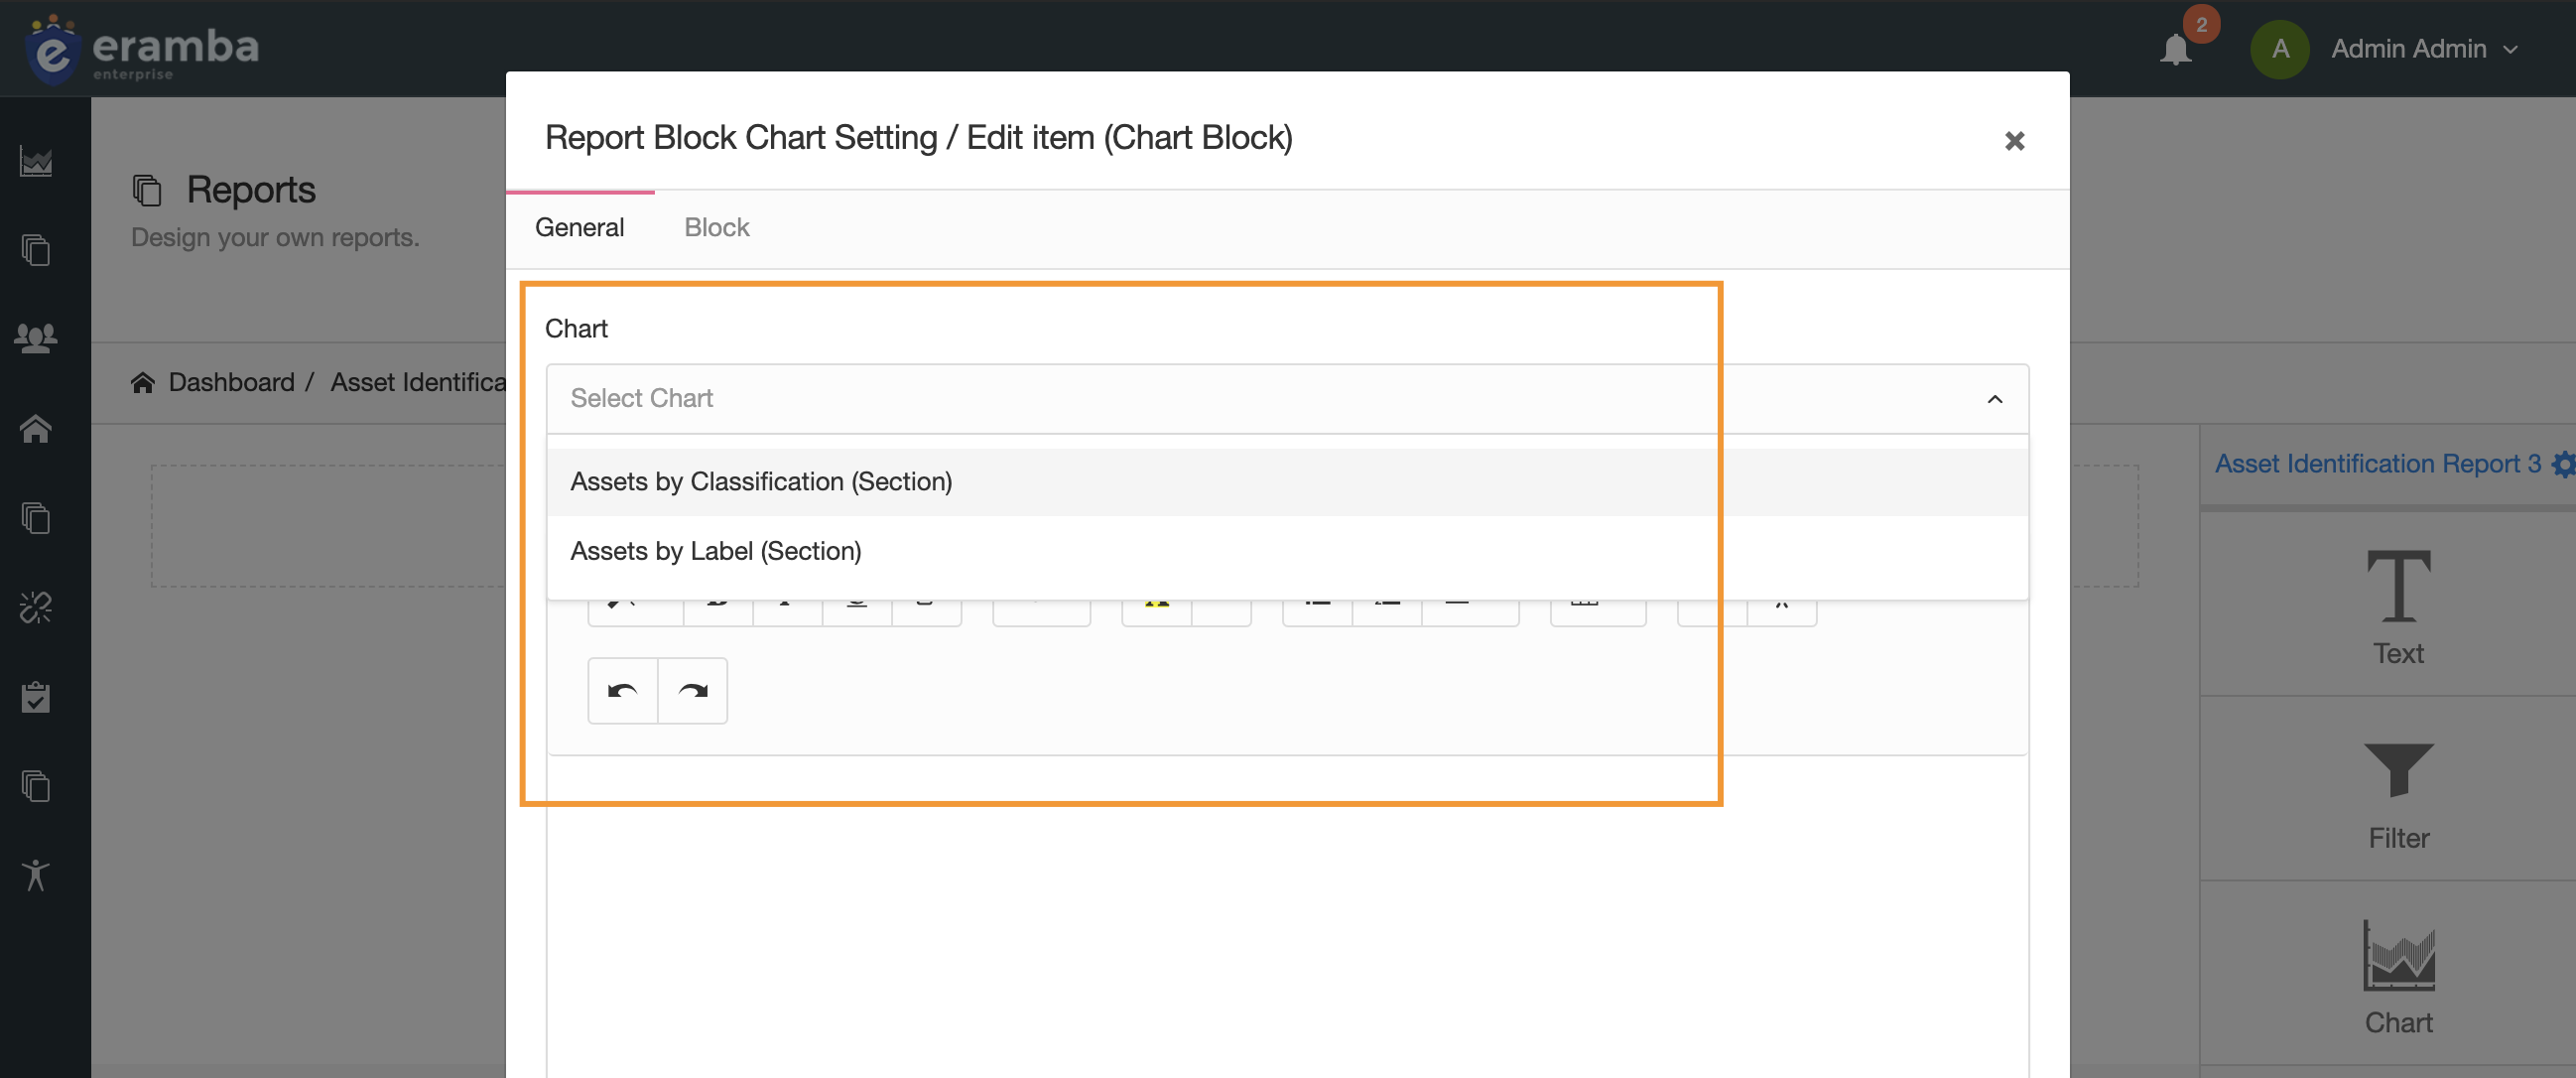
the user would have more dropdown options based on the number of custom fields defined. if the user deletes a custom field or disables custom fields the chart is not shown on the dropdown or the the report.