Ok we will be updating Risk modules to adjust things a little bit towards meeting the requirements of the EBA.
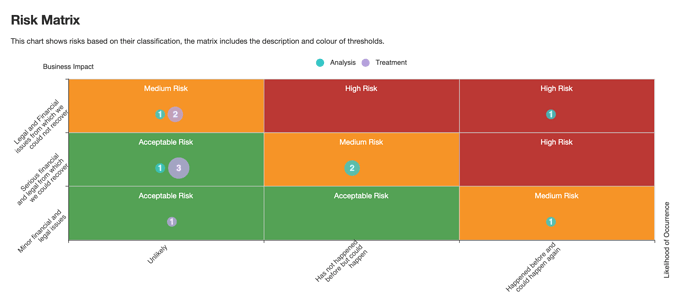
The risk matrix we have today depend on two things:
- having two “types” of classifications
- defining thresholds (each combination of x and y values and their respective colour and name)
Now for this EBA thing we need to be able to define more than two “types” of classifications, since a 2D matrix has two axes and nothing more we need to create more than one matrix to accommodate this problem.
The way we will do this is by:
1- letting the user define more than one classification type (nothing to be done here, as this is possible)
2- create a new Settings / Calculation Method (see “Calculation Method” below)
3- adjust Settings / Risk Appetite settings (see “Risk Appetite”)
4- adjust risk forms (see “Risk Forms”)
5- adjusting filters (see “Filters”)
6- adjusting report charts
Calculation Method
We need a new calculation method called “European Banking Authority” (nor now, this im sure will change) where the user is allowed to choose one type of risk classification as “Likelihood” and more than one type of classification as “Impact”.
Note: the one selected under “Likelihood” should not be allowed on the dropdown of “Impacts”
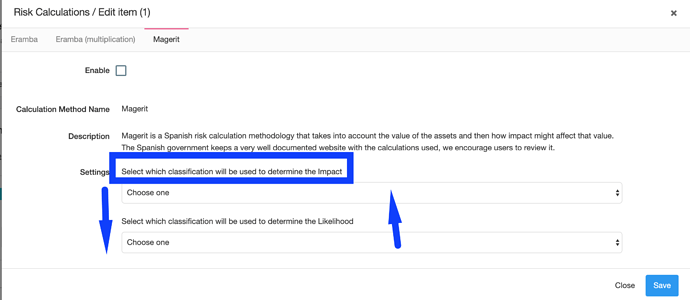
Is really similar UX as we have on magerit (but the calculation is totally different , this is why we can not re-use it) just the dropdowns aree upside down and impact is a multiple select drop down.
Note: once this is selected and edited and saved, risk recalculations must take place
Risk Appetite
The idea is that now with this risk calculation eramba will be able to create more than one matrix. for example if the user had defined:
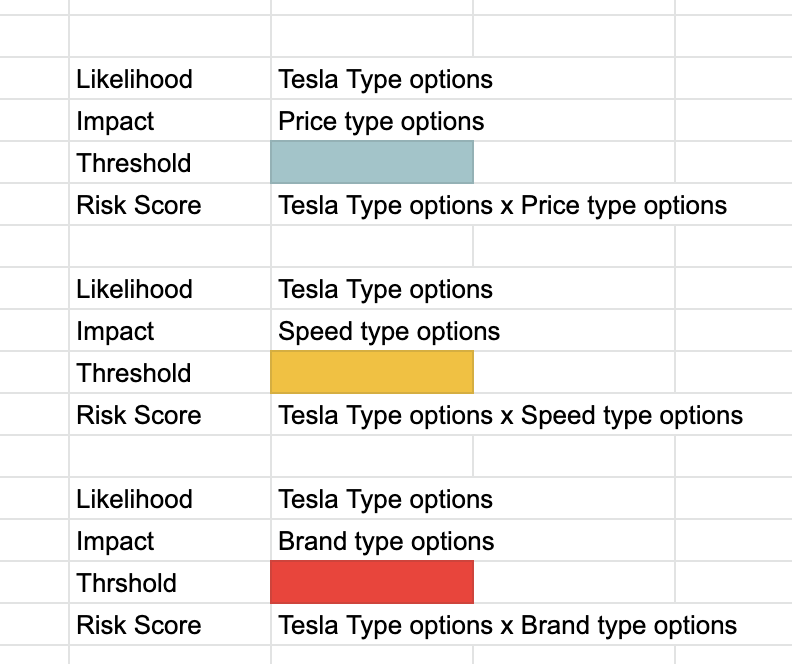
Likelihood Classification Type: Tesla
Impact Classification Types: Price, Speed, Brand
Then we should be able to provide three matrix:: Tesla x Price, Tesla x Speed and Tesla x Brand … and each matrix has its own threshold definitions … so the current threshold UX must be “upgraded” when the risk calculation to be used is defined as this new type.
We need to limit which calculation types can use which appetite types, the following table shows the possibilities:
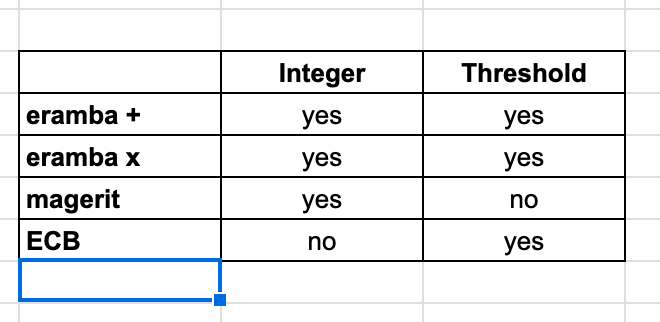
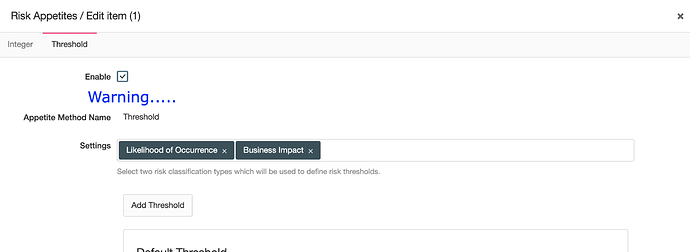
Based on what the calculation was selected you enable or disable totally one or another tab. if no calculation was choosen you disable both. The disable tab needs a red warning message: “The Risk calculation selected (Settings / Risk Calculation) is not compatible with this Risk appetite option”
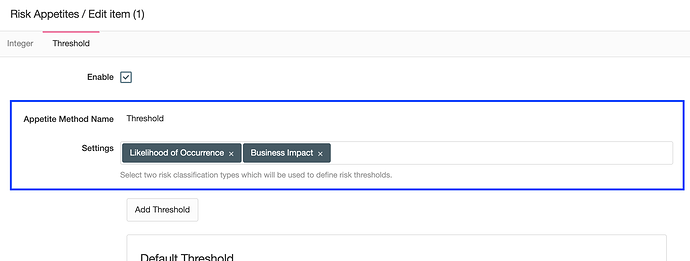
Once that above is done, remember that the threshold tab must be adjusted ONLY if ECB calculation is chosen because multiple matrix will be created out of this calculation type, you will need two adjustments:
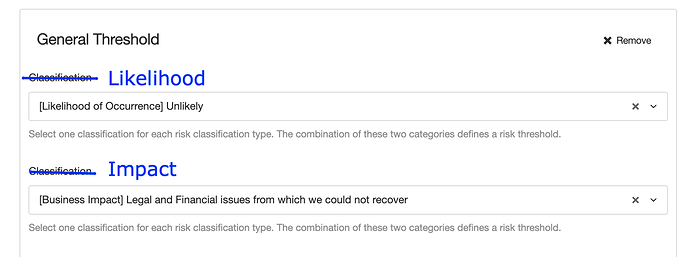
- The “Default Threshold” will need to be created as many times as “Impacts” have been defined on the calculation setting of ECB, make sure you show as an additional string the one the user is adjusting.
- The “Add Threshold” frame needs to be adjusted, on the top dropdown the user selects the “Likelihood” and on the second one it selects the “Impact” (Price, Speed, Brand). Change the labels so is obvious to the user what they are doing.
Risk Forms
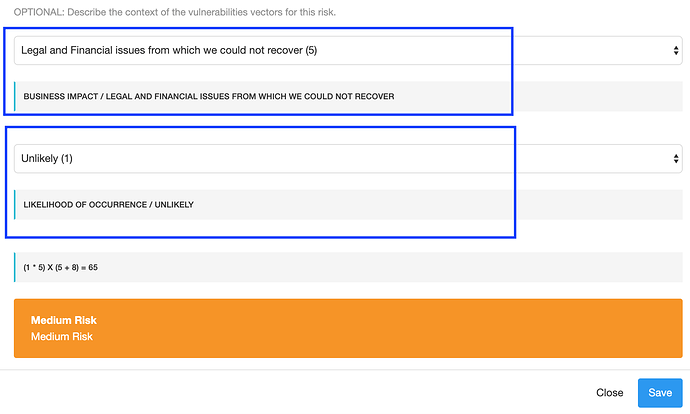
If this risk calculation is used then the risk form will need to be updated since the user needs now to define for each type of impact the likelihood:
So following our example the UX needs to accommodate all these new classification types and three thresholds and three risk scores
This presents a change as we typically always have a unique risk score, now we can have multiple (as many “impacts” are defined). This is why this change is a bit of a pain in the ass.
Filters
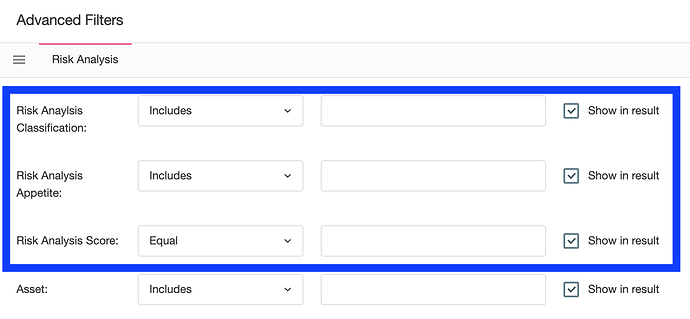
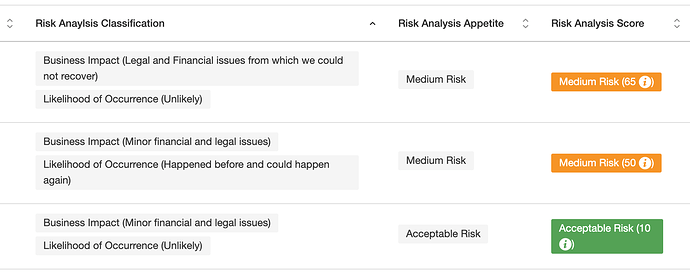
We need to adjust must be dynamically created as opposed of what we have today, these are the three fields which are relevant here (one for risk analysis and one for risk treatment):
They show today the following data:
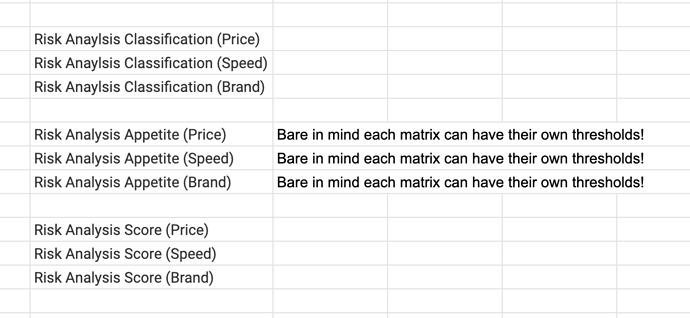
Well, now we need to show:
This is because the user needs separate columns on the filters so they can play with them as they wish.
Reporting
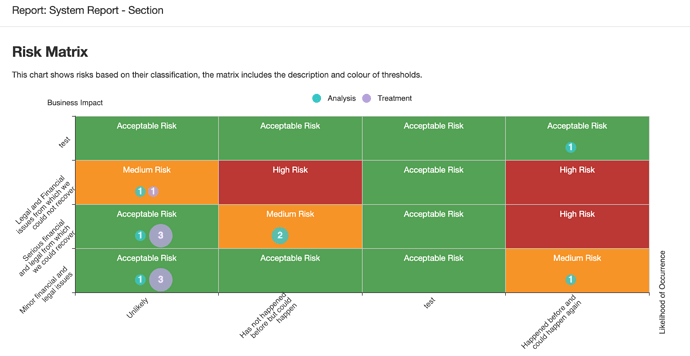
When we create item or section reports we need charts that reflect these three types (as per our example, but remember they can be 2, 5 or 10) so these chart must be created as many times as need:
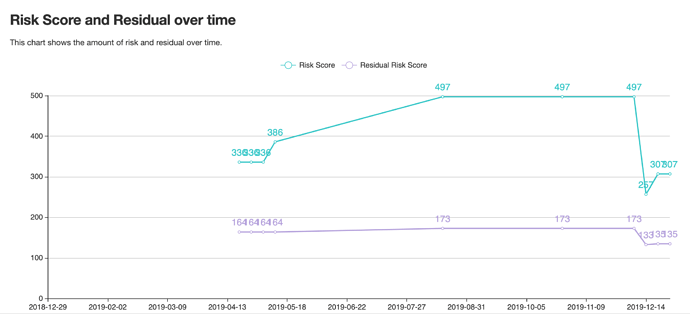
Same goes fort this, with a pair of lines for each likelihood x impact combination.
All other charts remain the same. How we want to do this, if making a new “chart type” or adjusting the current one to automatically transform itself based on the settings … well…i dont care is your decision.
