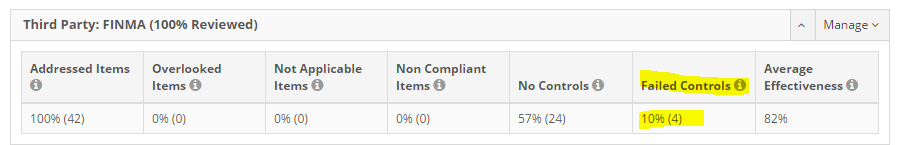
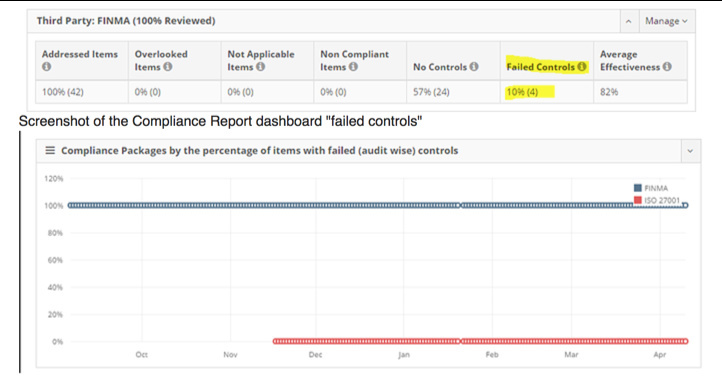
In the Compliance Package overview it clearly states: Failed controls = 10% (4 items). But in the dashboard it shows 100% since a long time… Is there any reason for this deviation
This is a bug , dashboards will change drastically in the next couple of months. I’ll share a preview in a couple of weeks once we are done with the damn new workflows.
The draft explanation of the new dashboards:
The draft key performance indicators we have in mind:
Let me know if you have trouble visualising these two files.
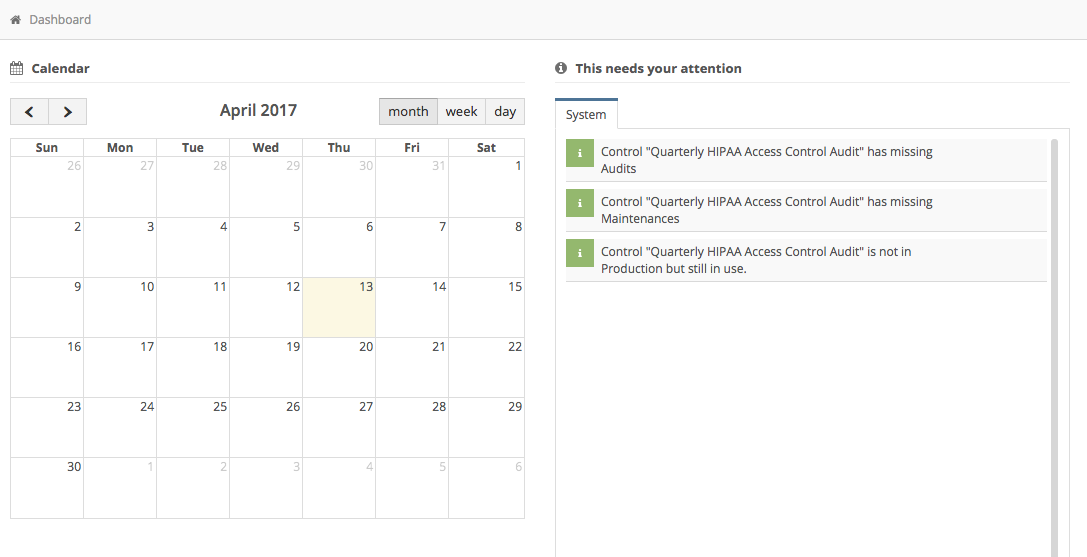
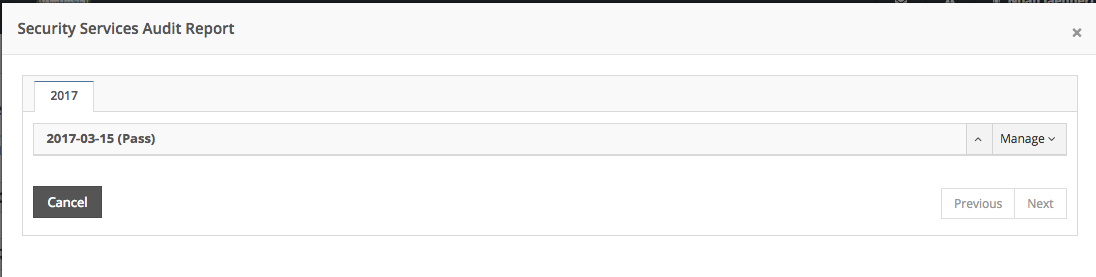
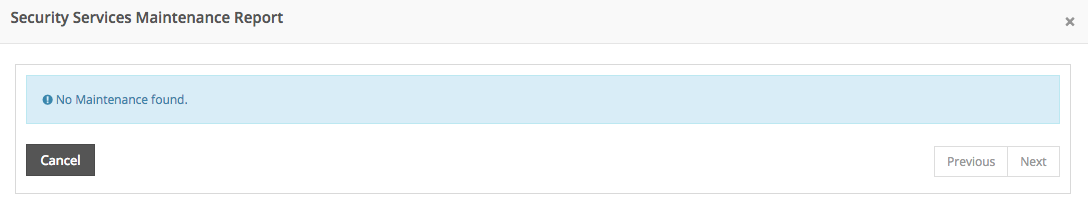
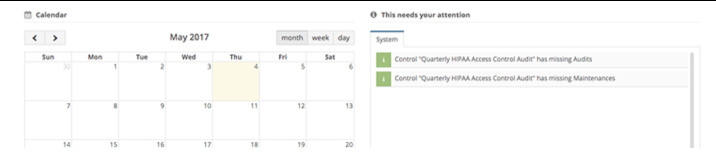
Not sure if this is related or not, but I am seeing possibly a similar issue. The calendar shows that my control is missing audits and maintenances, and is not in production. See below:
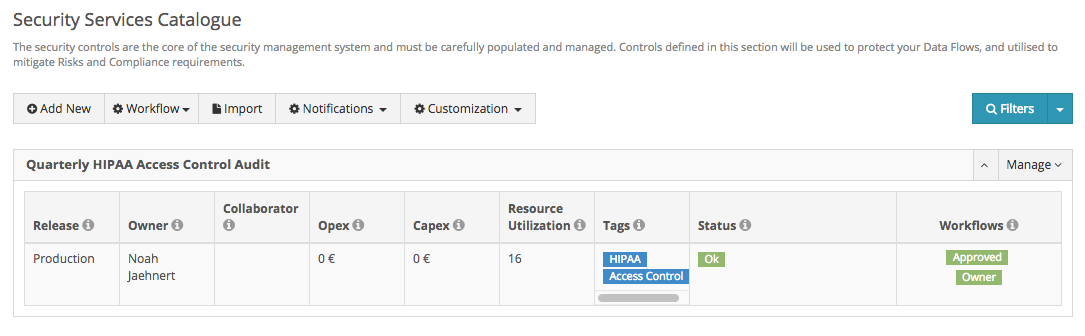
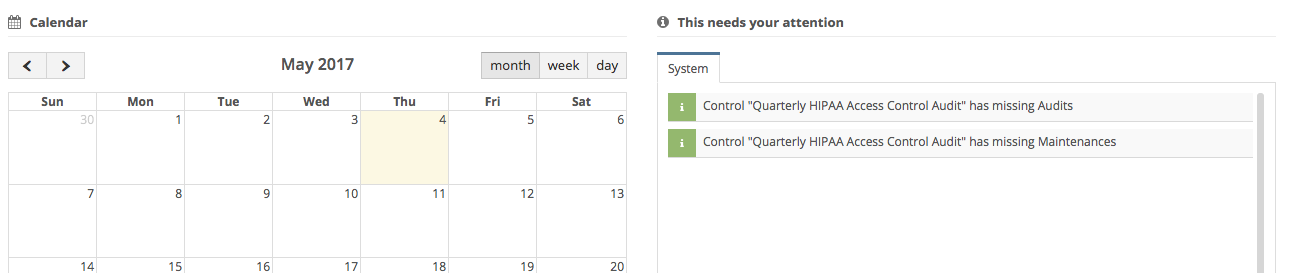
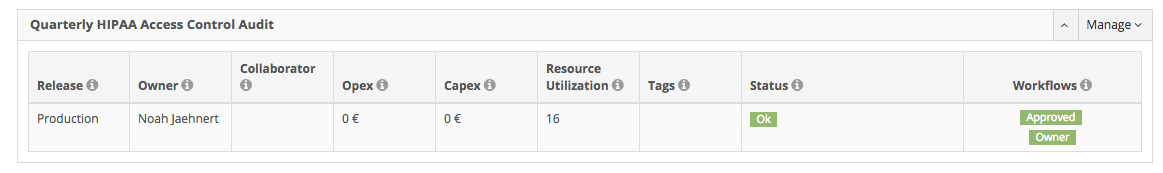
I seem to still be having this problem even after the r34 upgrade. I deleted and recreated my security control (Quarterly HIPAA Access Control Audit) and only included one audit for it, and no maintenances. I still get the following on the Dashboard: