since 2.x template is pretty much deployed everywhere and there seems to be less bugs (believe it or not) we’ll work a bit on charts and filters in the coming releases, two main objectives:
1- make filter options simpler to understand
2- make new item and section charts, with a focus on financials.
this post focus on #2 we want to answer:
how much a single risk costs?
risks can have controls linked, controls have opex and capex fields. out of that we can calculate an approximate cost (since controls can have more than one risk, we split the cost in equal parts) … for example:

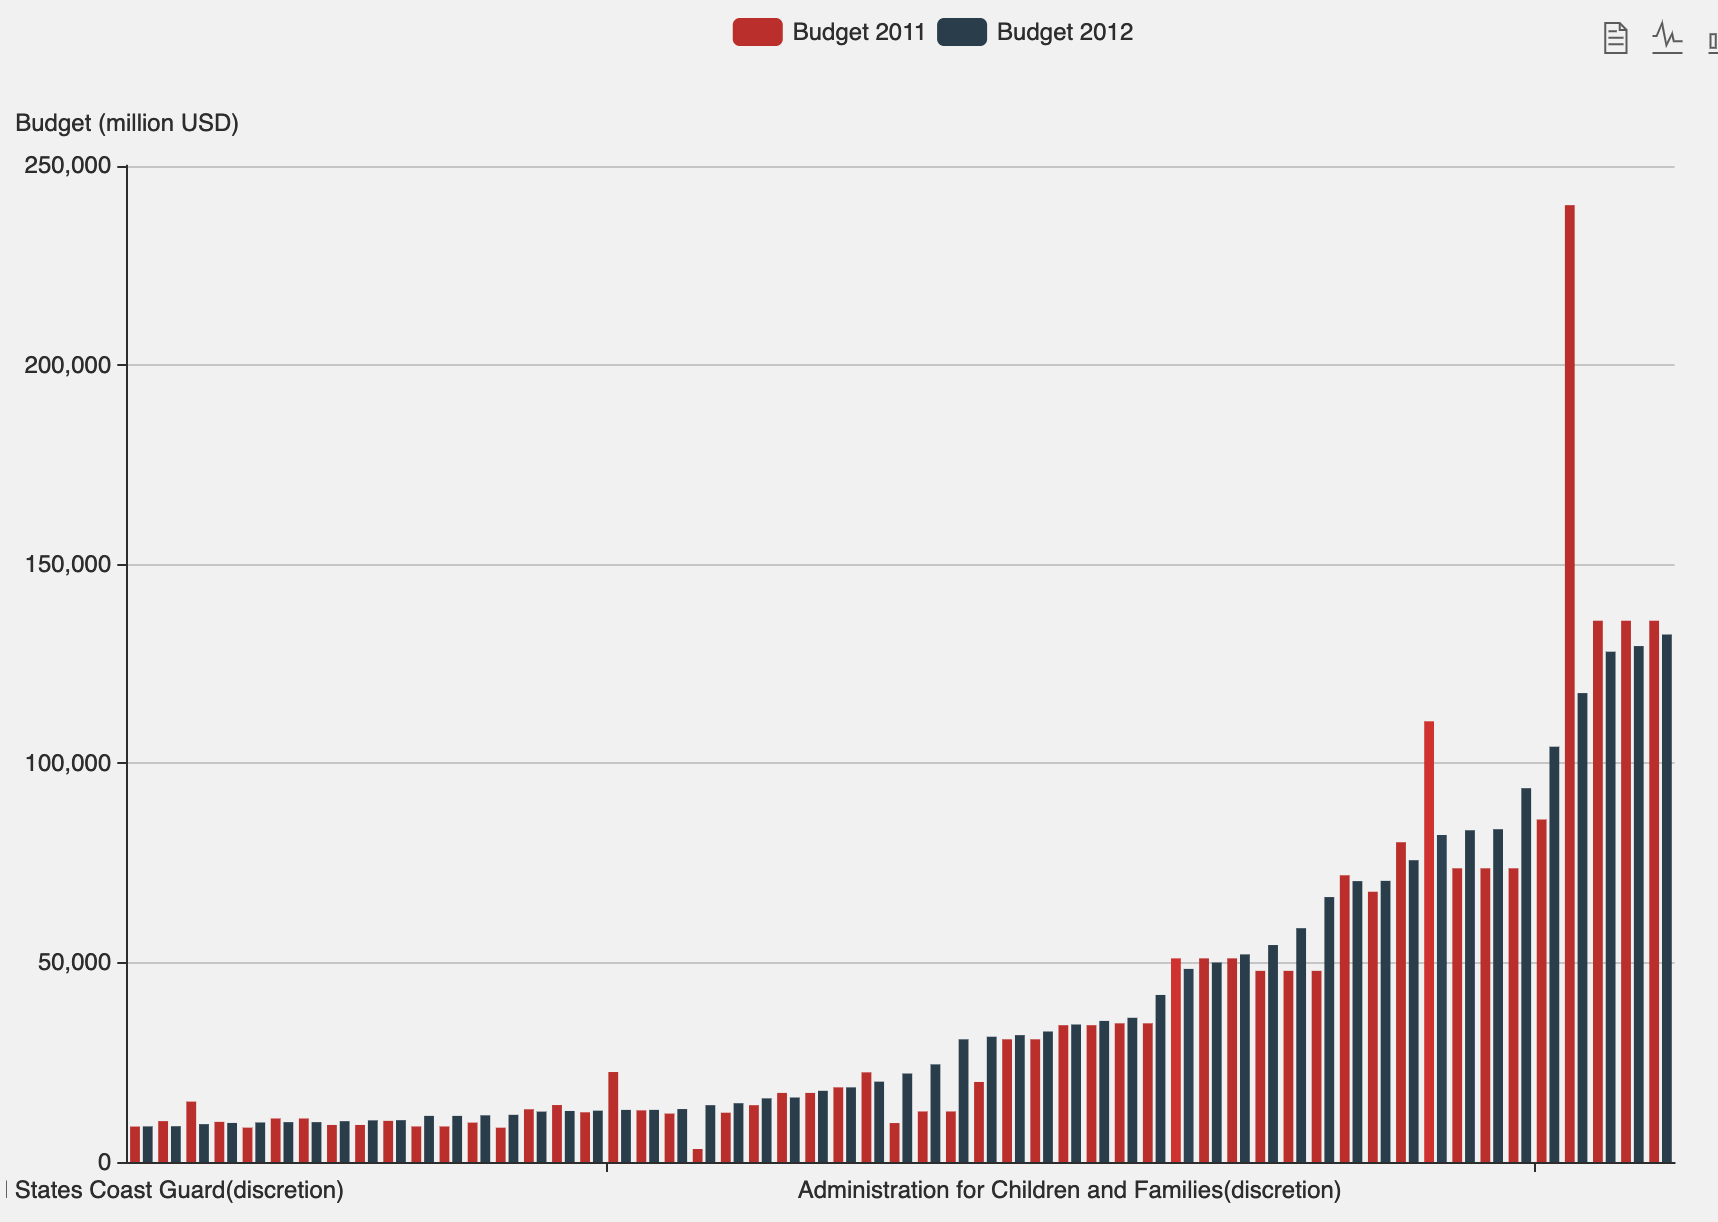
we want to make of this an item report, it will show the cost of all risks and the one you selected on a different colour so you can see how that compares to other risks.
We need a filter update on the risks that show this values (agregated opex and capex) as filter options too.
Note: this calculation will not have in consideration if those controls are used in otehr things outside risk module (compliance for example) as if they would, in theory the cost would be less as is leveraged across other GRC needs. we feel this is too complicated to explain to non grc people and perhaps this is best to leave aside.