Allow the use of multiple integers so we can reflect high medium and low rather than just above risk appetite.
Alternatively , maybe I could use liabilities to apply weighting to the risks so I can still use the threshold method?
Liabilities could be
Confidentiality - High - Risk Magnifier 5
Confidentiality - Medium Risk Magnifier 3
Confidentiality - Low Risk Magnifier 1
Integrity - High - Risk Magnifier 5
Integrity - Medium - Risk Magnifier 3
etc etc
Thoughts?
Thanks
we use thresholds and they dont work with number but with the classifications of the risk, what you suggest is another threshold methodology that uses number values instead of classifications?
Yes, correct a threshold methodology that uses number values instead of classifications
Thanks
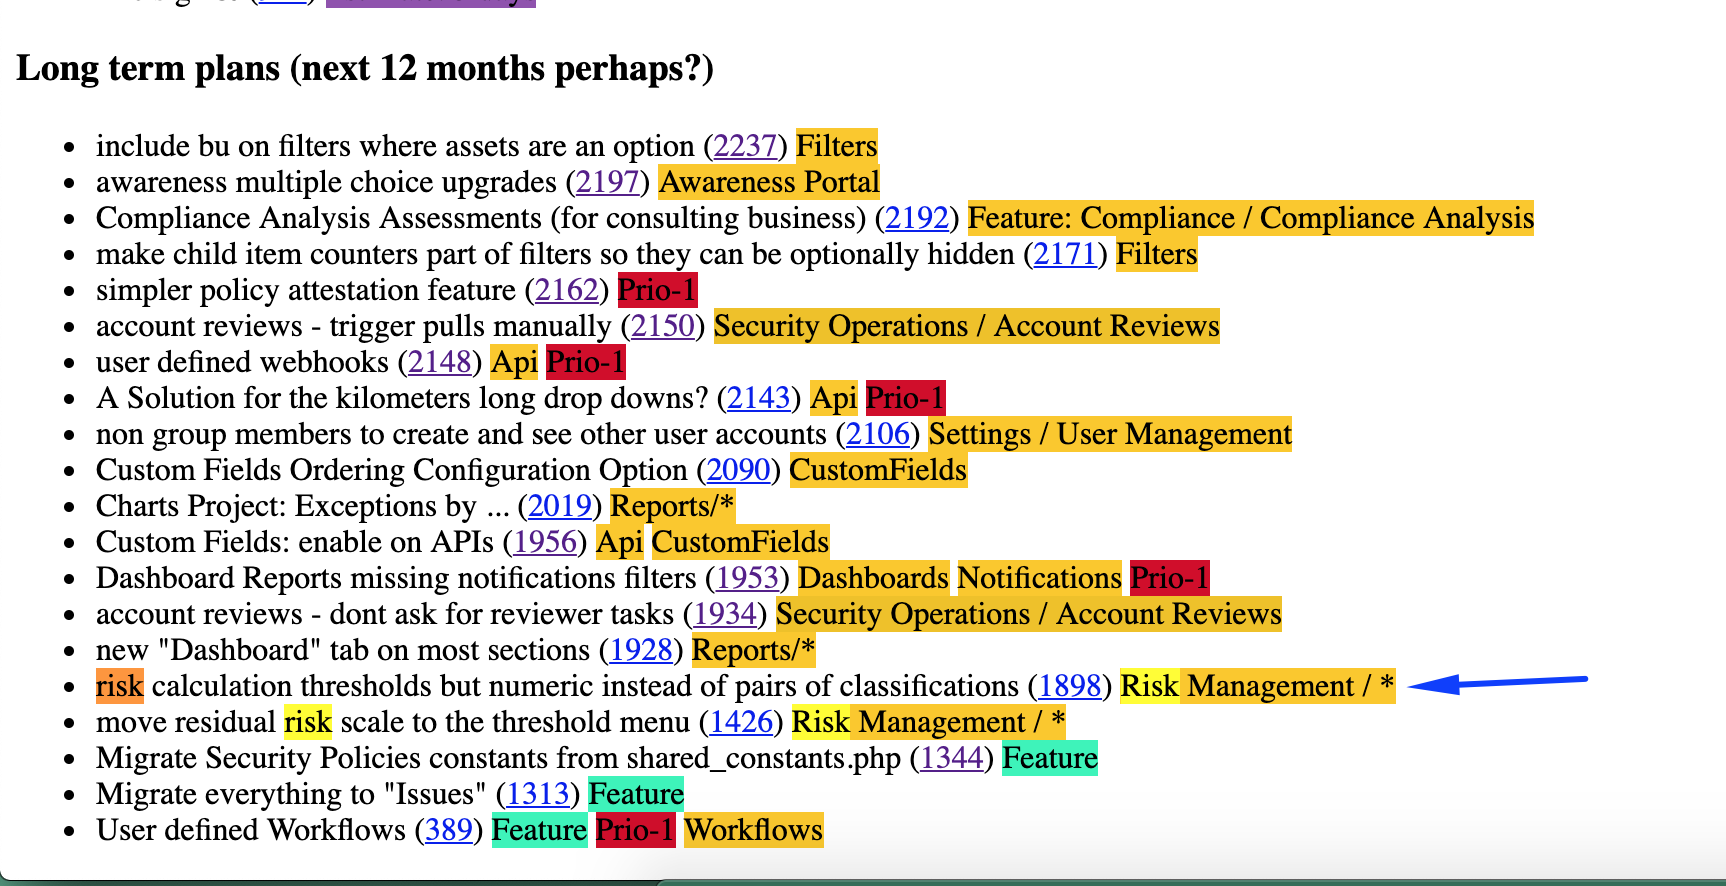
right - it has been on the roadmap for a while (12 jan 2019) and it will be done … just dont know when yet!!
Great Thanks, looking forward to it!!
Quick question, are we supposed to be able to see the github issues? I don’t have access assume due to being a private repo?
Thanks
If this is implemented I think it would be an idea to also consider adding control maturity scores to audits, much like there is compliance efficacy?
It makes more sense to me for the control maturity to be carried through to the compliance rather than setting an arbitrary percentage in the compliance module.
In theory the process could work as follow, when conducting an audit, the auditor scan score the maturity of the results, say using the well known control maturity model…
20% Initial (chaotic, ad hoc, individual heroics) - the starting point for use of a new or undocumented repeat process.
40% Repeatable - the process is at least documented sufficiently such that repeating the same steps may be attempted.
60% Defined - the process is defined/confirmed as a standard business process
80%Capable - the process is quantitatively managed in accordance with agreed-upon metrics.
100% Efficient - process management includes deliberate process optimization/improvement.
This can then be fed to the control, and in turn risks.
It could be possible to then use the user calculated risk analysis score and automatically set the treated risk score by using the control maturity, and the treated score would be reduce overtime as the control matures?
The maturity of the controls would also impact the compliance as controls get mapped to the compliance items?
Thoughts?
this would be best to have it addressed in a separate post so we dont mix up things !
going back to the risk feature, defining thresholds based on integers might complicate things in terms of heat-maps as numerical thresholds might overlap, any graphical representation of a heat-map for numerical thresholds would be useful to work on the feature. in fact, as many as possible would make it even better - please use screenshots!
There is overlap here, but maybe it would help in prioritising the different levels. i.e which medium risks should be addressed first
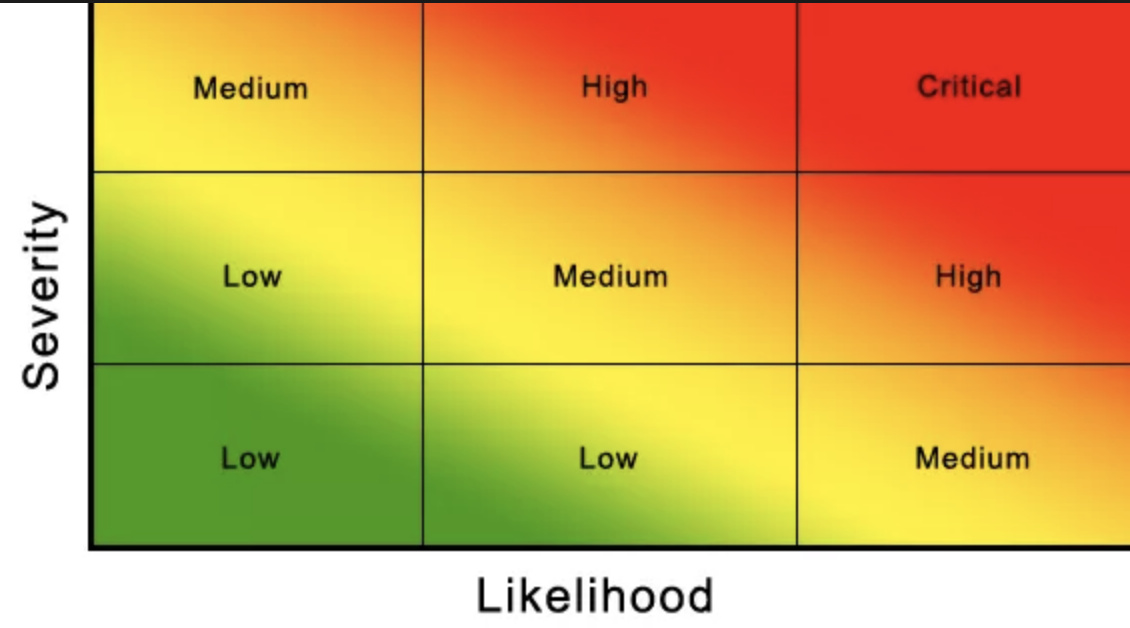
To make something in that direction the thresholds are then defined as coordinates:
If impact is in between 0 and 20 and likelihood is in between 0 and 20 then call it “make do” and paint it green
right?
the gradient is something i need to double check on the graph libraries how it could work … not exactly easy to do charts in web applications
Yep, that sounds like the correct approach
Thanks
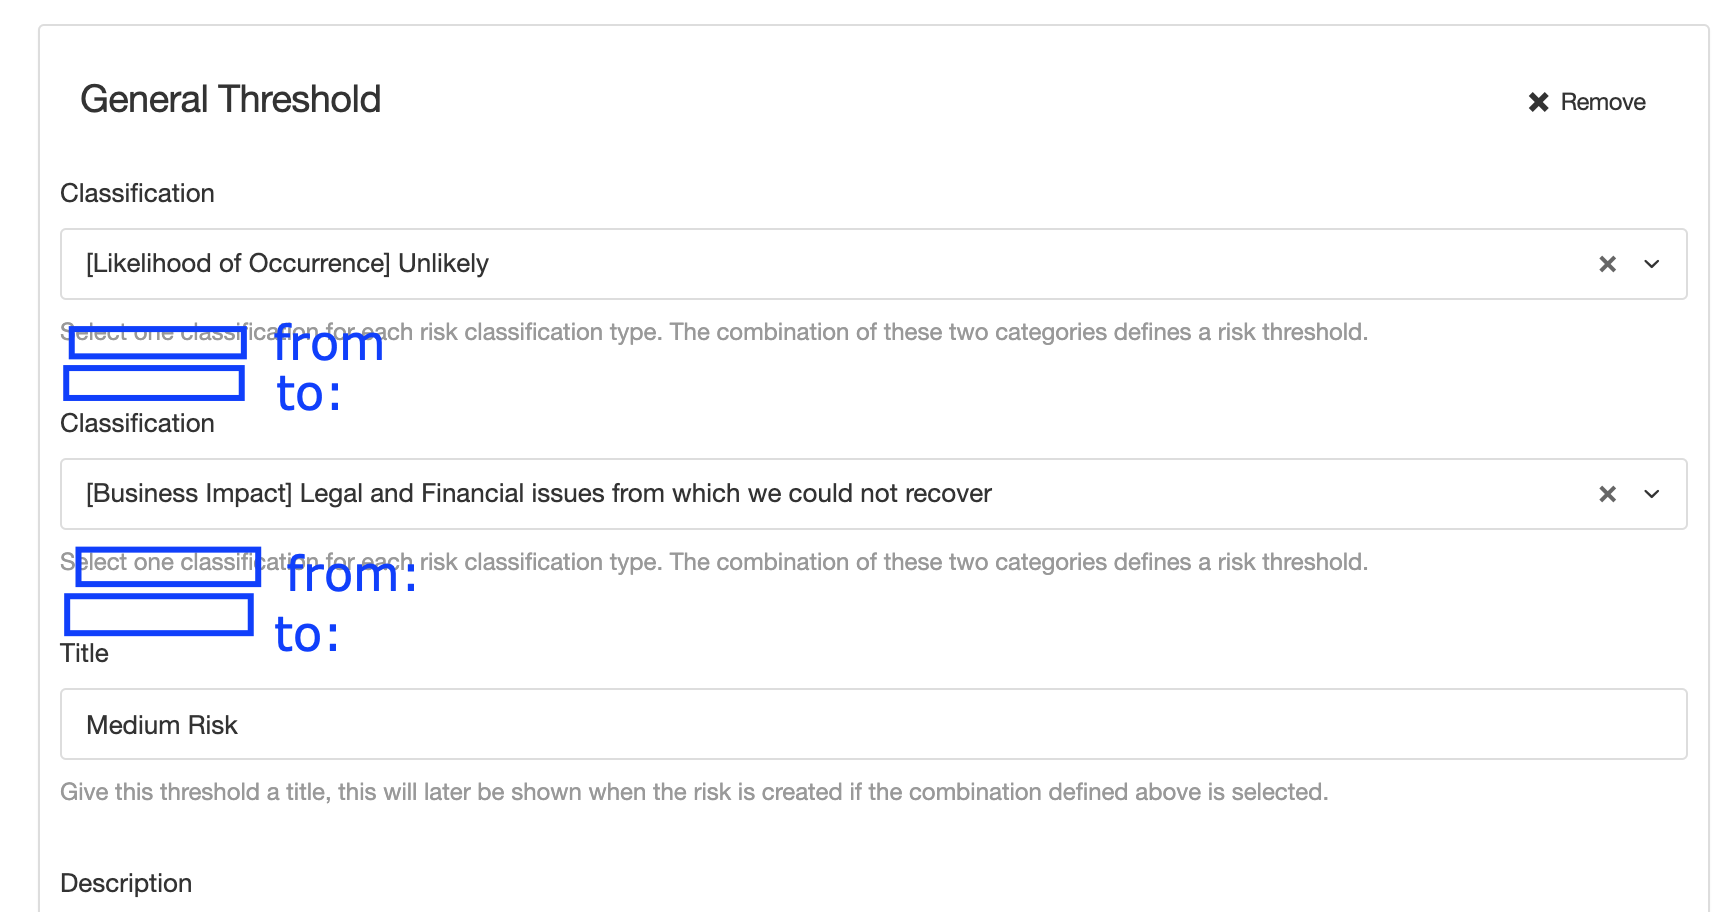
So then we will add a third option on Risk Mgt / Settings / Risk Thresholds called “Thresholds - Integer” (we’ll need to rename the other thresholds to “Thresholds - Risk Classifications” , the ux is similar to the one we already have:
1/ the user needs to choose from the available “Classification Types” , only those used in “Calculation Method” should be shown!

2/ there is no “Default” range, so remove this setting:
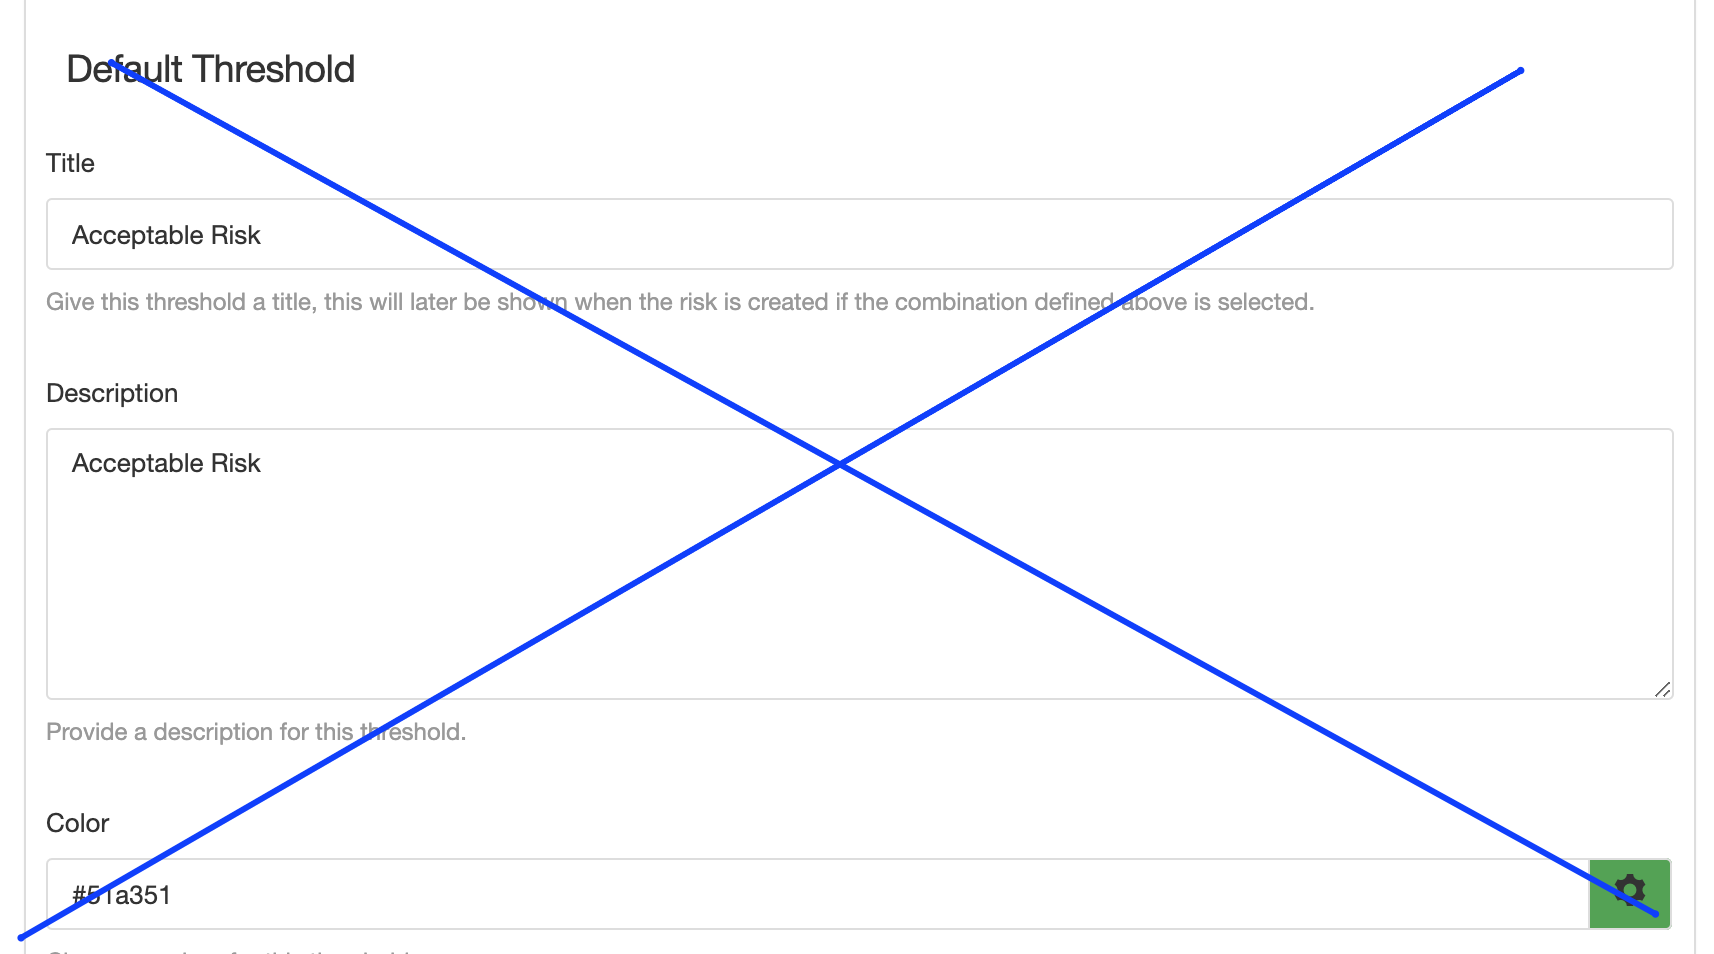
3/ the user can define one or more (no limit in my view) thresholds for each selected classification type (selected above) and two numeric, positive, integer values for each one of them, “From” and “To”…i’m pretty sure “To” needs to be a higher value than “from” so we need some javascript to check that on real time.
then the other settings (tittle, description, colour) remain the same.
===== Chart work =====
we need to update the existing charts (Risk Matrix (Thresholds) + Risk Matrix) to include a few things:
- the classification numerical value in brackets after the title of the classification
- using the coordinates from the risk , position a x or something where each risk is. since you have two pairs of coordinates for each risk (analysis and treatment) you need to x for each risk (on different colours)
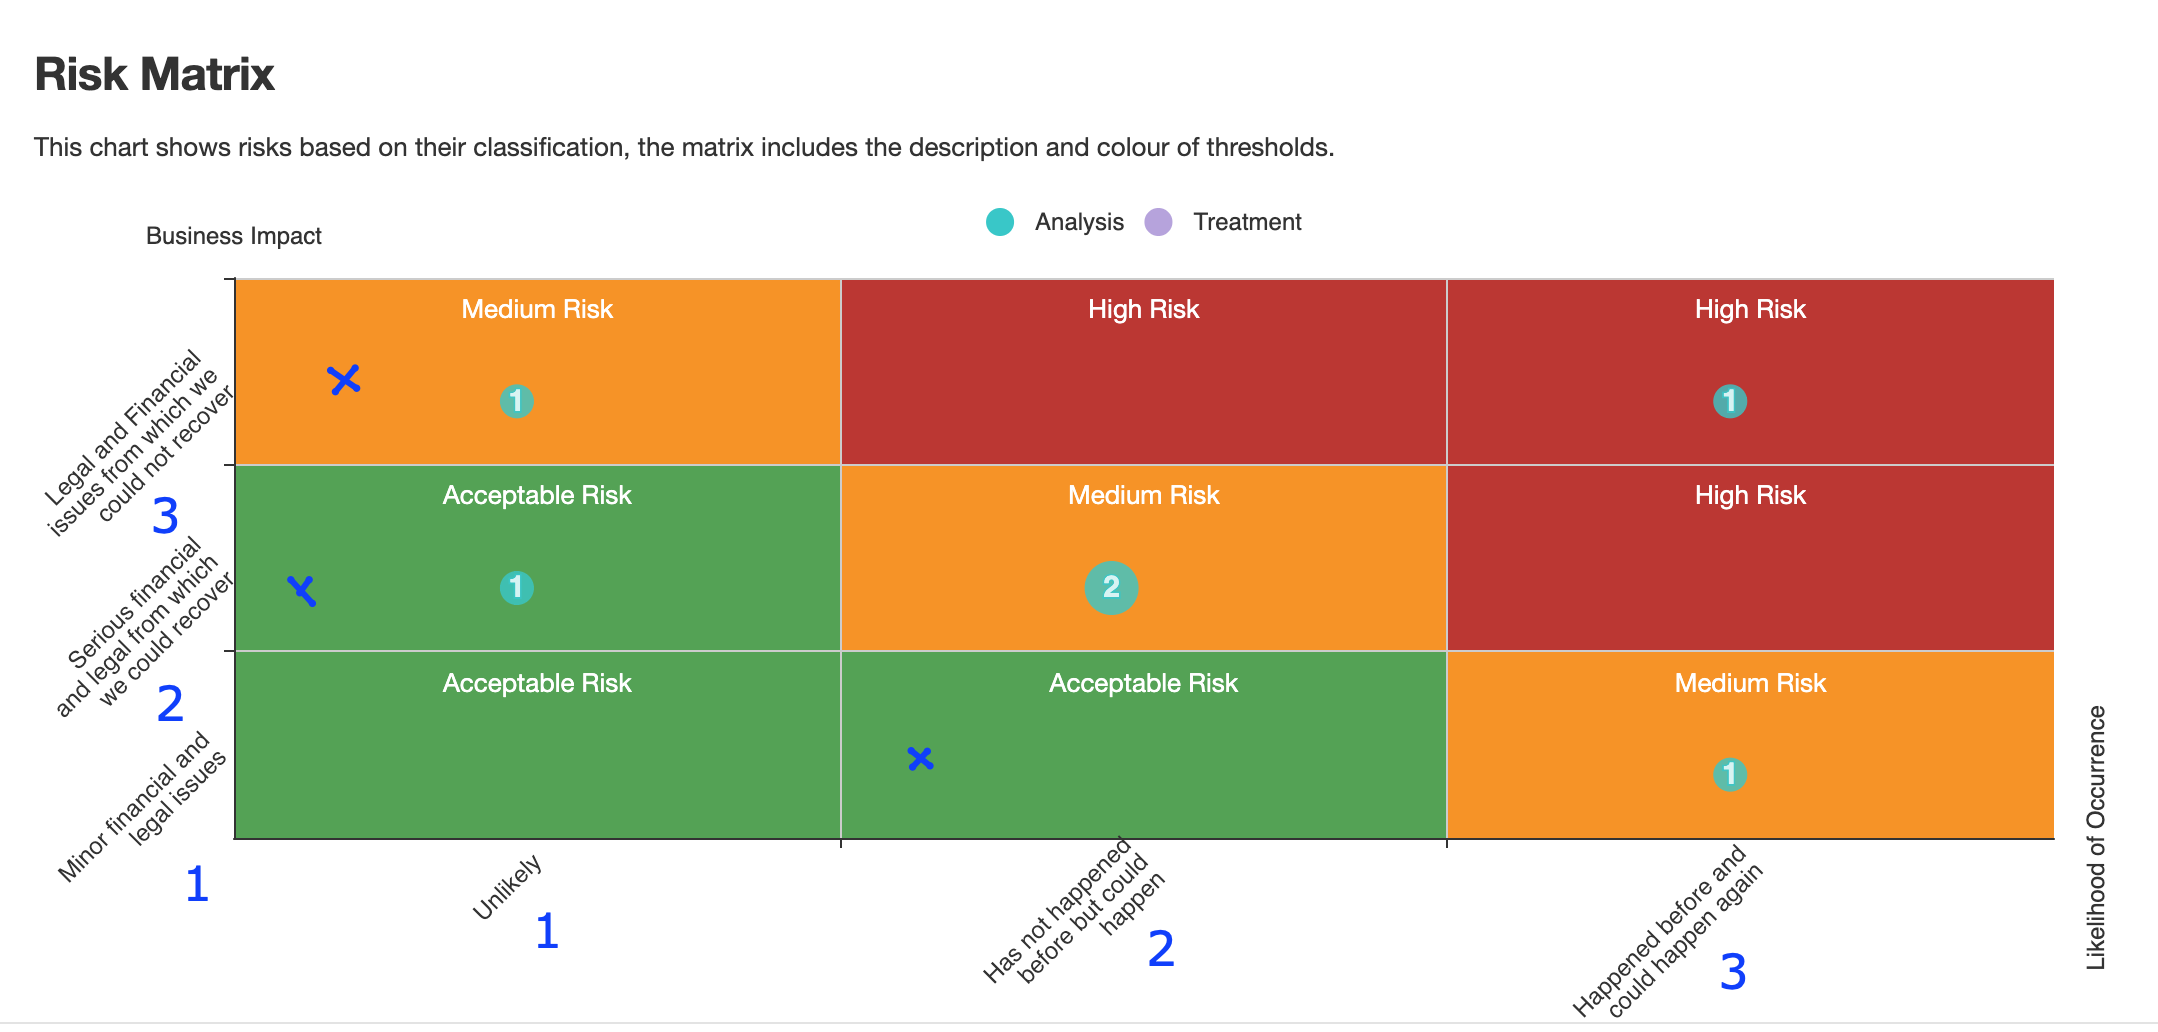
note: update the title of the chart to be called “Risk Matrix Thresholds - Risk Classification”
Then we need to include a new chart (item and section) for this new type of threshold:
- Title: “Risk Matrix Thresholds - Integer”
- Description: This chart shows risks based on their risk score, the matrix includes the description and colour of thresholds
the chart needs to follow the design we have but use the integer thresholds and the gradient (good luck with that)
Warning: bare in mind the “enabled” option logic remains the same, only one option can be enabled and if changed the system needs to recalculate all risks based on the newly selected option.
Sounds good, would we be able to use the Magerit calculation method with this?
yes, it should work because magerit returns two values for risk score on treatment and analysis
Correction, with Magerit you can have thresholds defined (colour, title and numerical values) but you cant have a two-axis chart because in Magerit the “impact” can be more than one classification (as many as the asset has defined) … so when i want to put coordinates on a 2 axis chart we miss a unique impact coordinate (a numerical value).
Can we have 3 charts or even maybe just take the highest value CIA score. For example if confidentiality has the highest score and show that and flagged the confidentiality so we know which is being reflect, the risk treatment should then focus on that, as the risk is reduced for this one, impact may become the biggest risk, in which case the risk would swap to showing that in the chart?
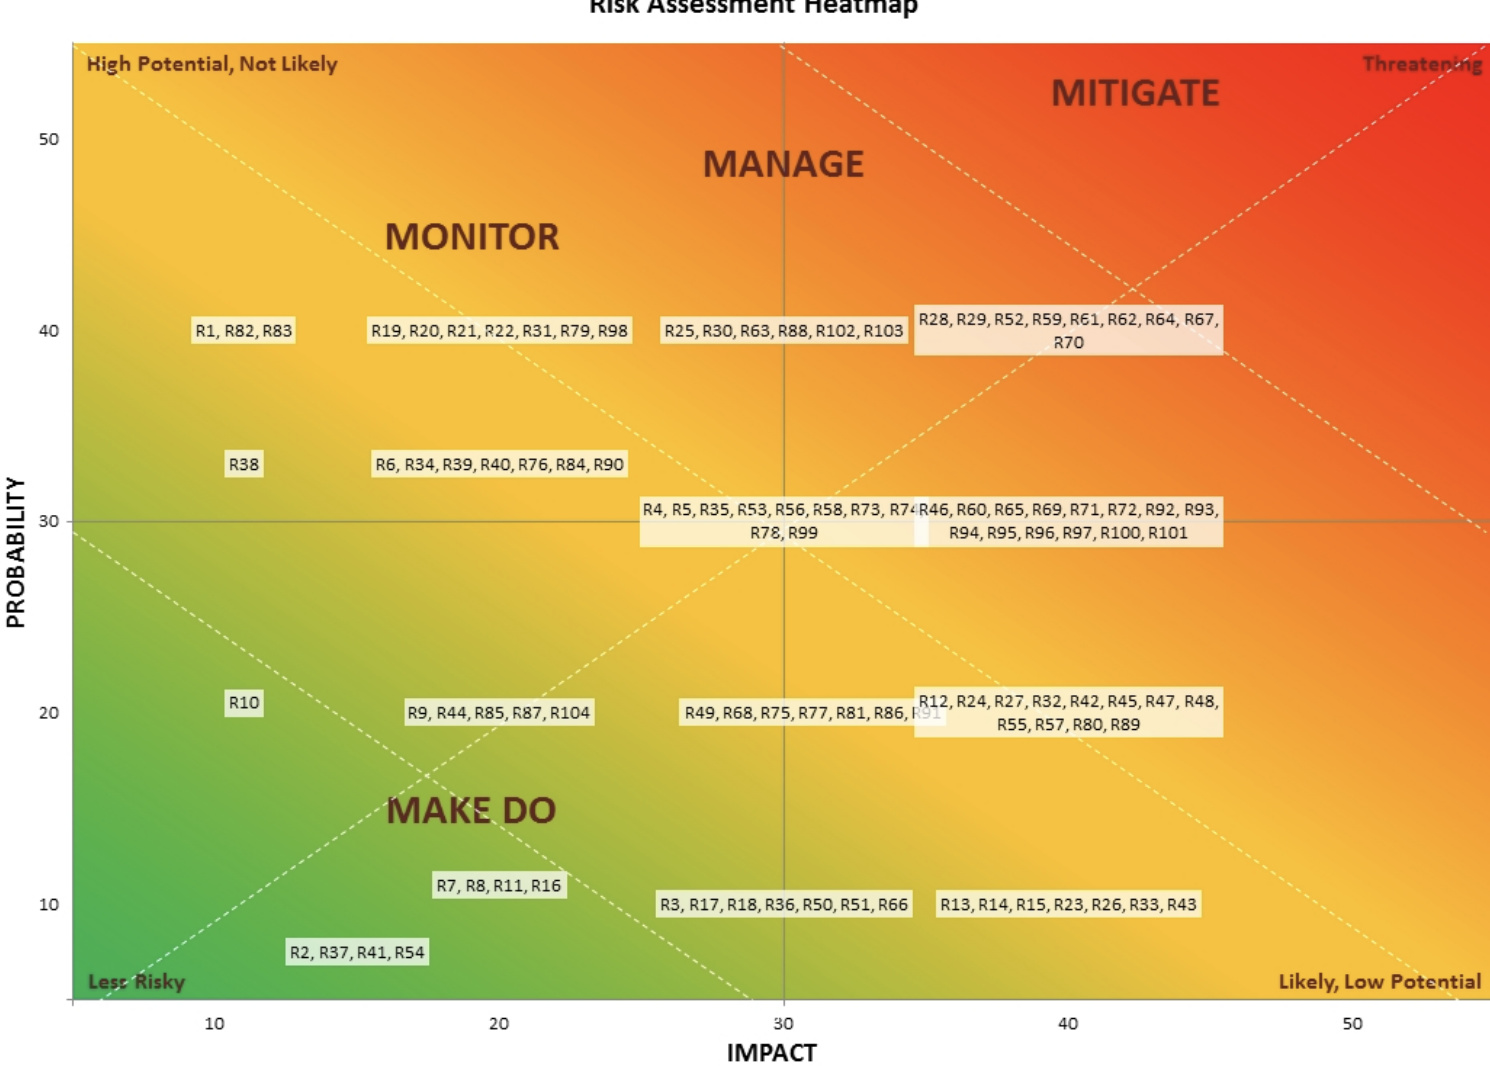
I would like to see a bit more of real life examples before we jump into this …i cant believe people is using Octave or Magerit (which are the same) and have no charts to report!!
This looks like a good solution? It looks like they are essentially taking the highest score as per my previous thoughts.
I do like the way they can score each of the threats against the asset in one view, interesting idea also.
yes we saw that when i was googling and trying to find something … its an academic paper from south america … i would prefer real life business organisation examples