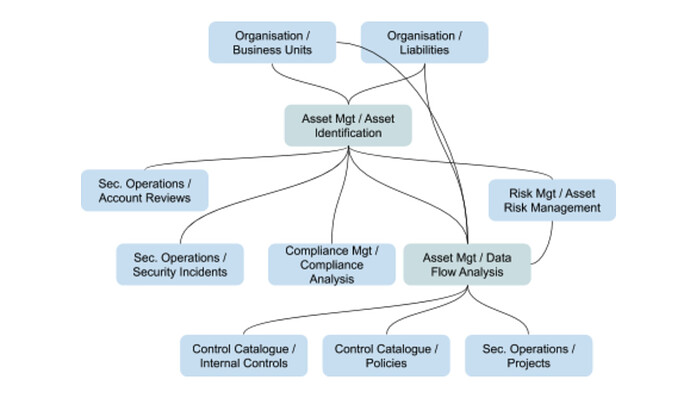
We need on every section an idea of what relationships exist with this module and other modules and if the relationships are mandatory or optional. This will help everyone understand how to use the system.
On every section, on the top right corner we’ll display the map (small) and when clicked it will open up and open a modal that on the top will show a chart like the one above (which will be dynamically loaded based on those related models)
The chart needs to show:
- 2 levels (risk link to assets and assets link to bu)
- what relationships are mandatory and which ones are optional
- a brief description on every relationship (defined by the core team)


