We are working on refreshing all charts and system reports on all sections, the job is about:
- reviewing the logic on how existing chart works (some dont make sense to me)
- making new system reports that look better, have better explanation on what is displayed, include new charts
- making new charts
- making all charts visualisation enabled, this means that the data on the chart is based on who you are instead of taking all data
for business units we’ll add the following charts:
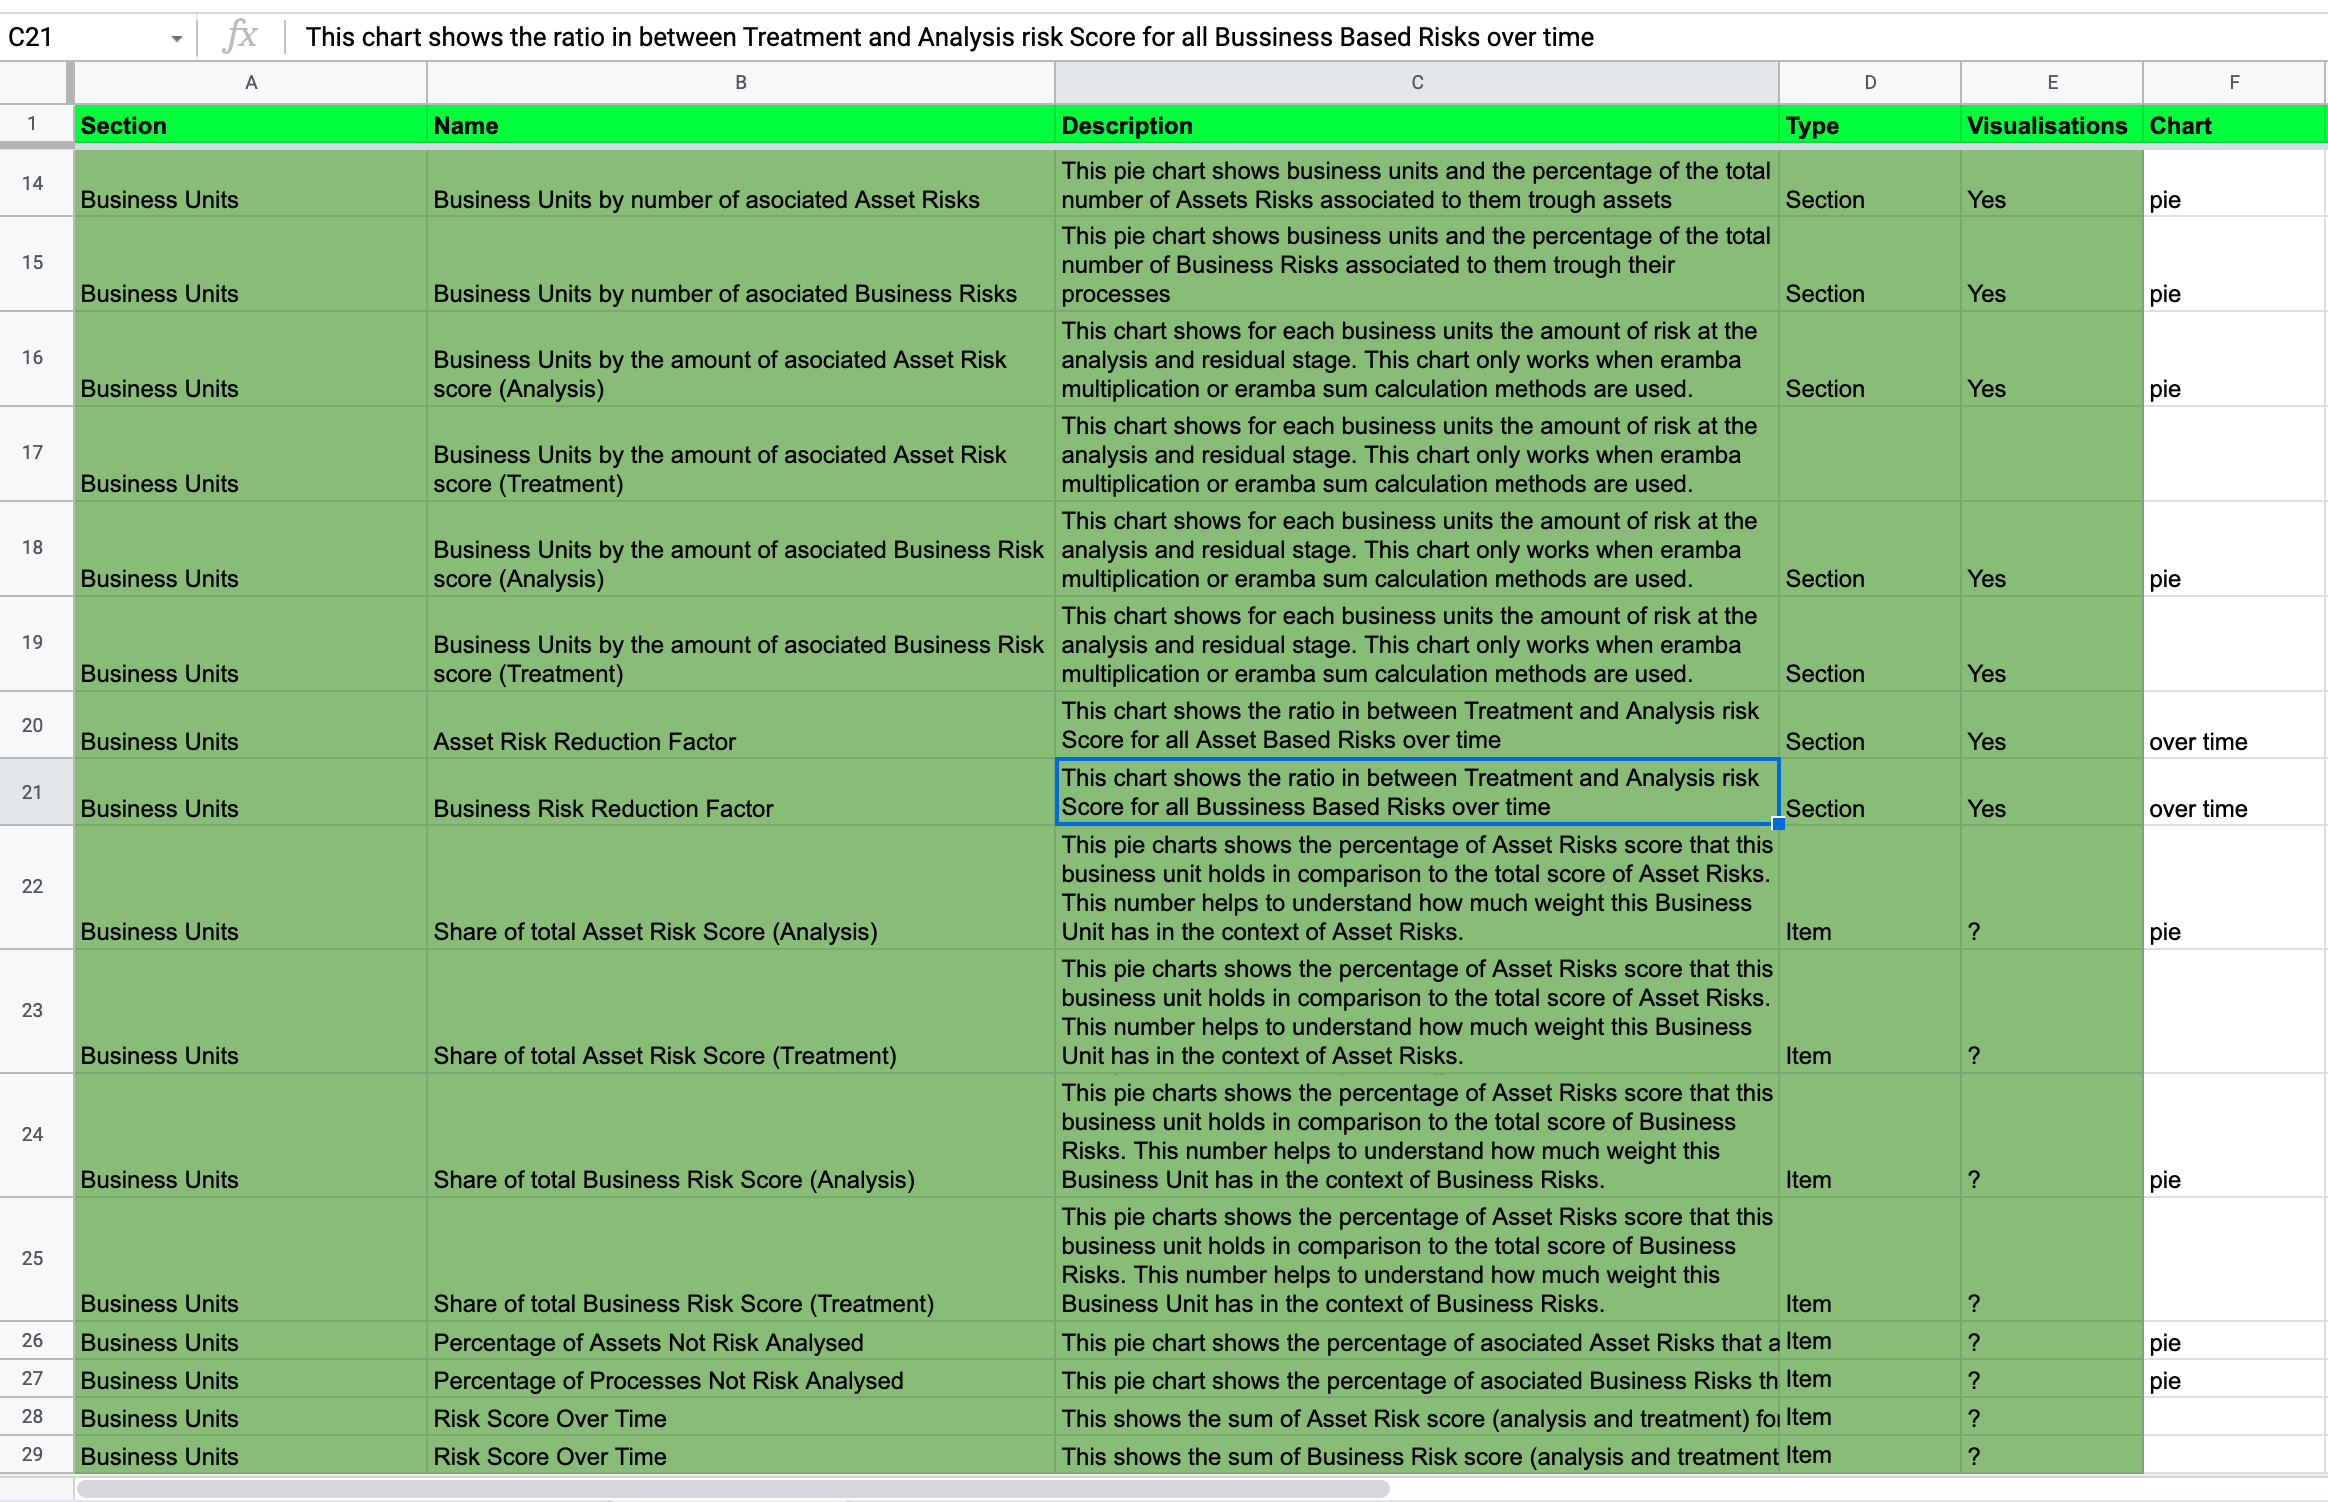
ref spreadsheet: https://docs.google.com/spreadsheets/d/1qmtLJIHhLg2Nv_T-L2oI6ICa1zfxouvn1KTmcKh9MYc/edit#gid=655700417
ref github: https://github.com/eramba/eramba_v2/issues/3420