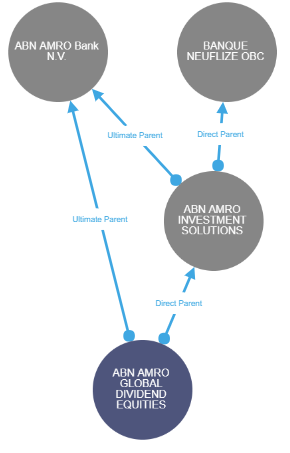
It would be great if Eramba could build a visualization of the relations between Assets, potentially even including risks (using color), controls and policies (but even a visualization of just the Asset would already be really helpful). The Cytoscape JavaScript library makes these visuals really easy to make, I just it myself a couple of times, for example, to show the relationship between of Legal Entities:
If this relation would be defined/used as a pure parent relationship (parent or parents of this asset) you would be able to get a full hierarchical relationship not? While MySQL doesn’t come with any good native graph queries I think it doesn’t directly request any modifications.
Firstly, apologies for reviving a 5 year old thread. I did a search and couldn’t see any more recent posts about this.
Any further thoughts on this original feature request please? I would like to be able to visually answer questions like:
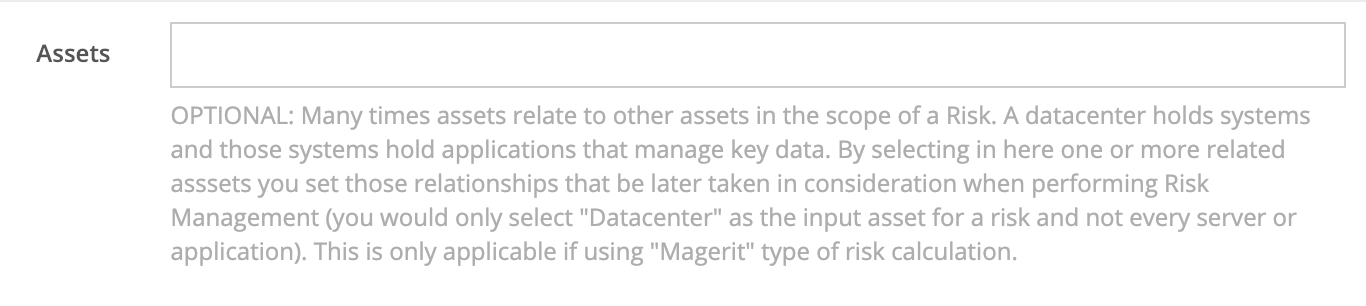
“Where is this data stored or processed?” - e.g. Linking a “Data Asset” type to “Software Asset” types as a “Related Asset”
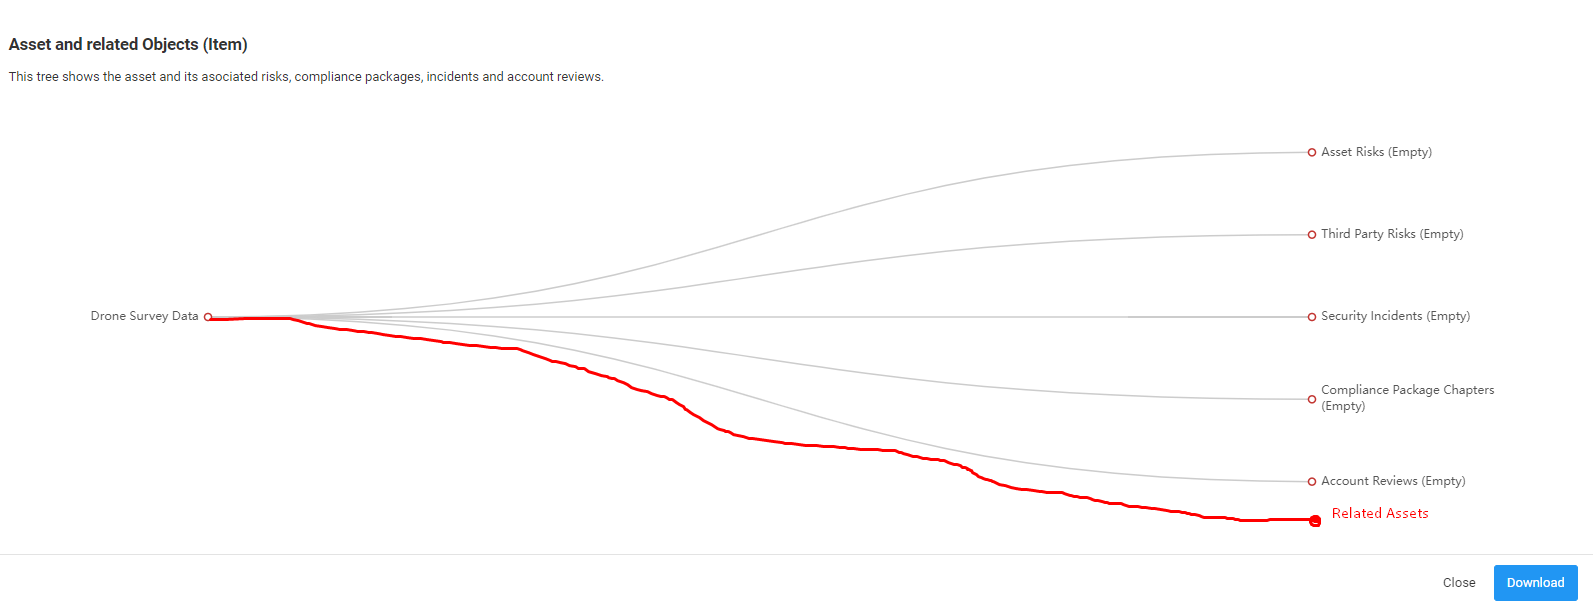
In the first iteration, even a simple representation of the existence of a relationship would be really beneficial, for example in the Relationship Diagram in the Reports function. This can be evolved overtime depending on demand from the wider Eramba userbase, but for now just showing a link would be really helpful in being able to answer simple questions from the business.
It just helps add greater context to other analysis tasks, and would also facilitate off platform conversations about aggregate risks.