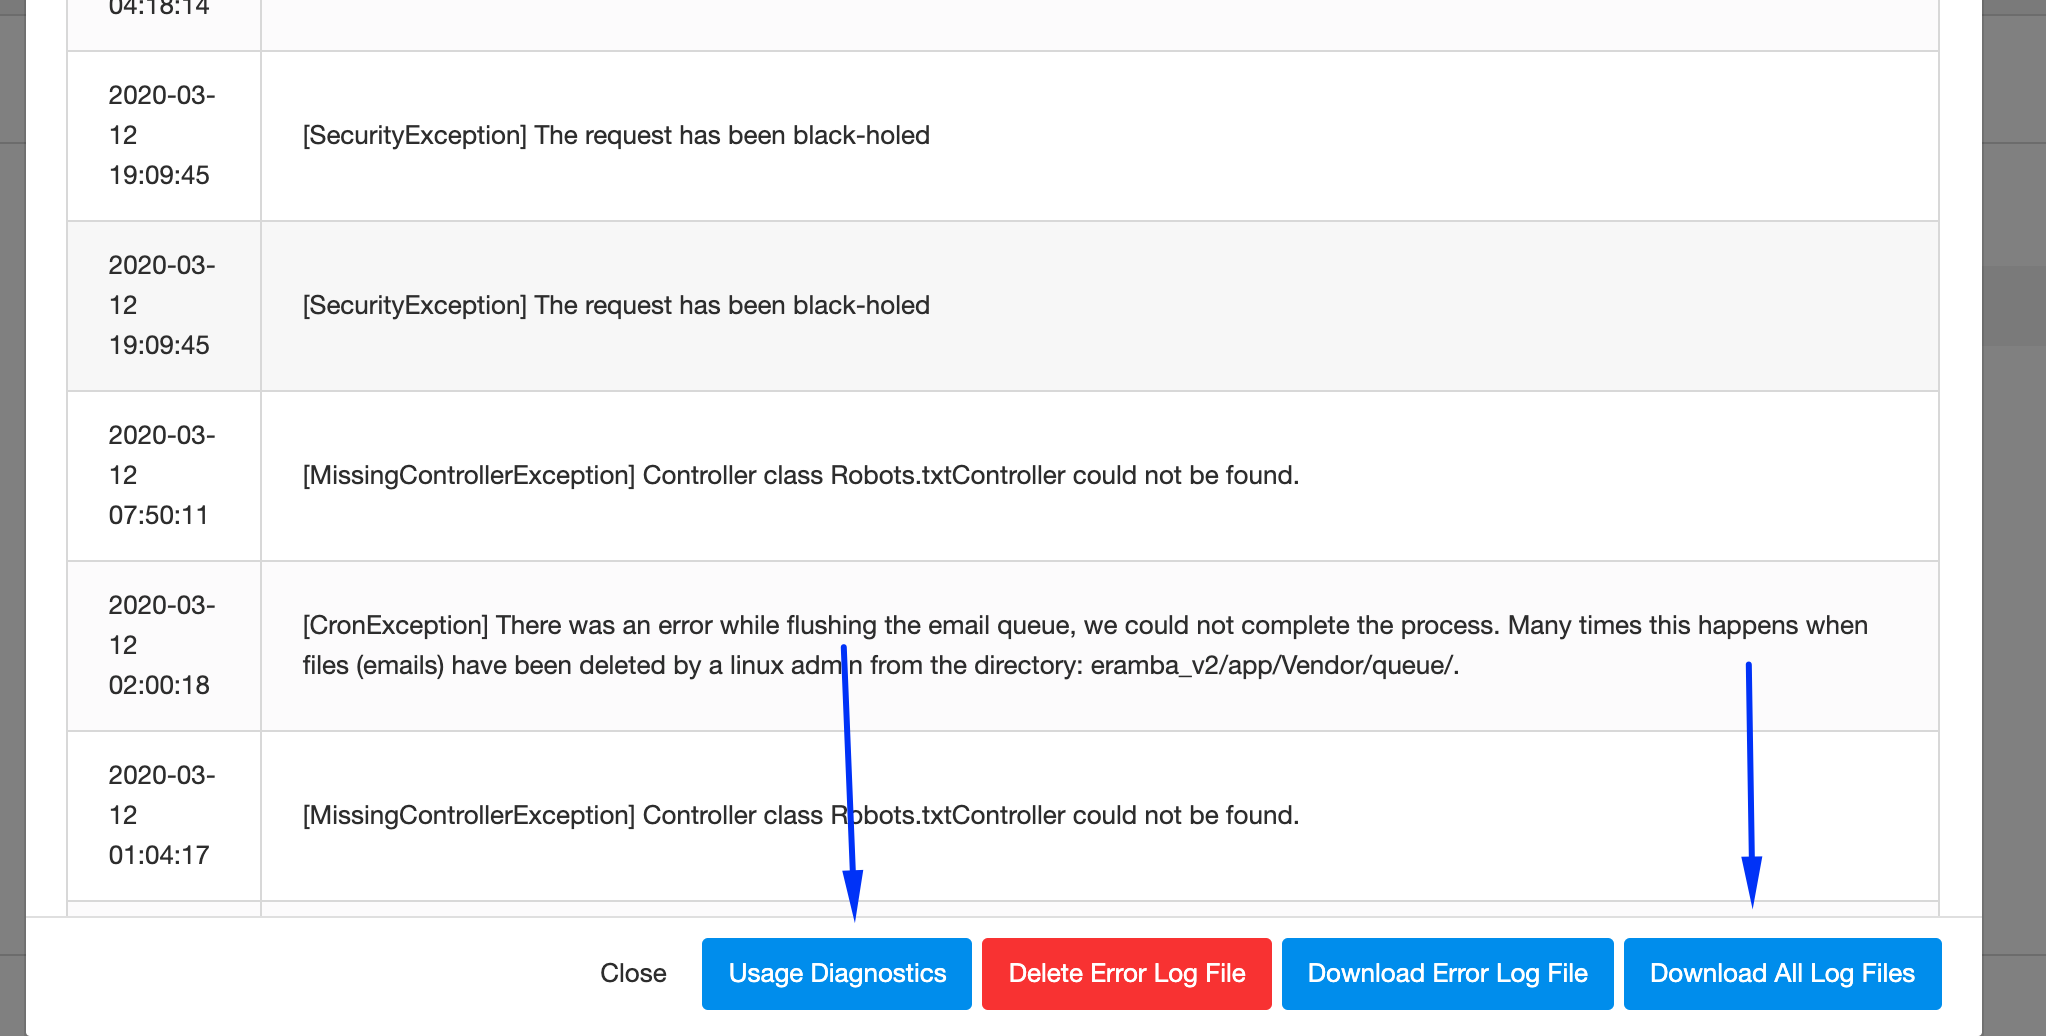
1/ Go to system / settings / error logs and download all files and diagnostic:
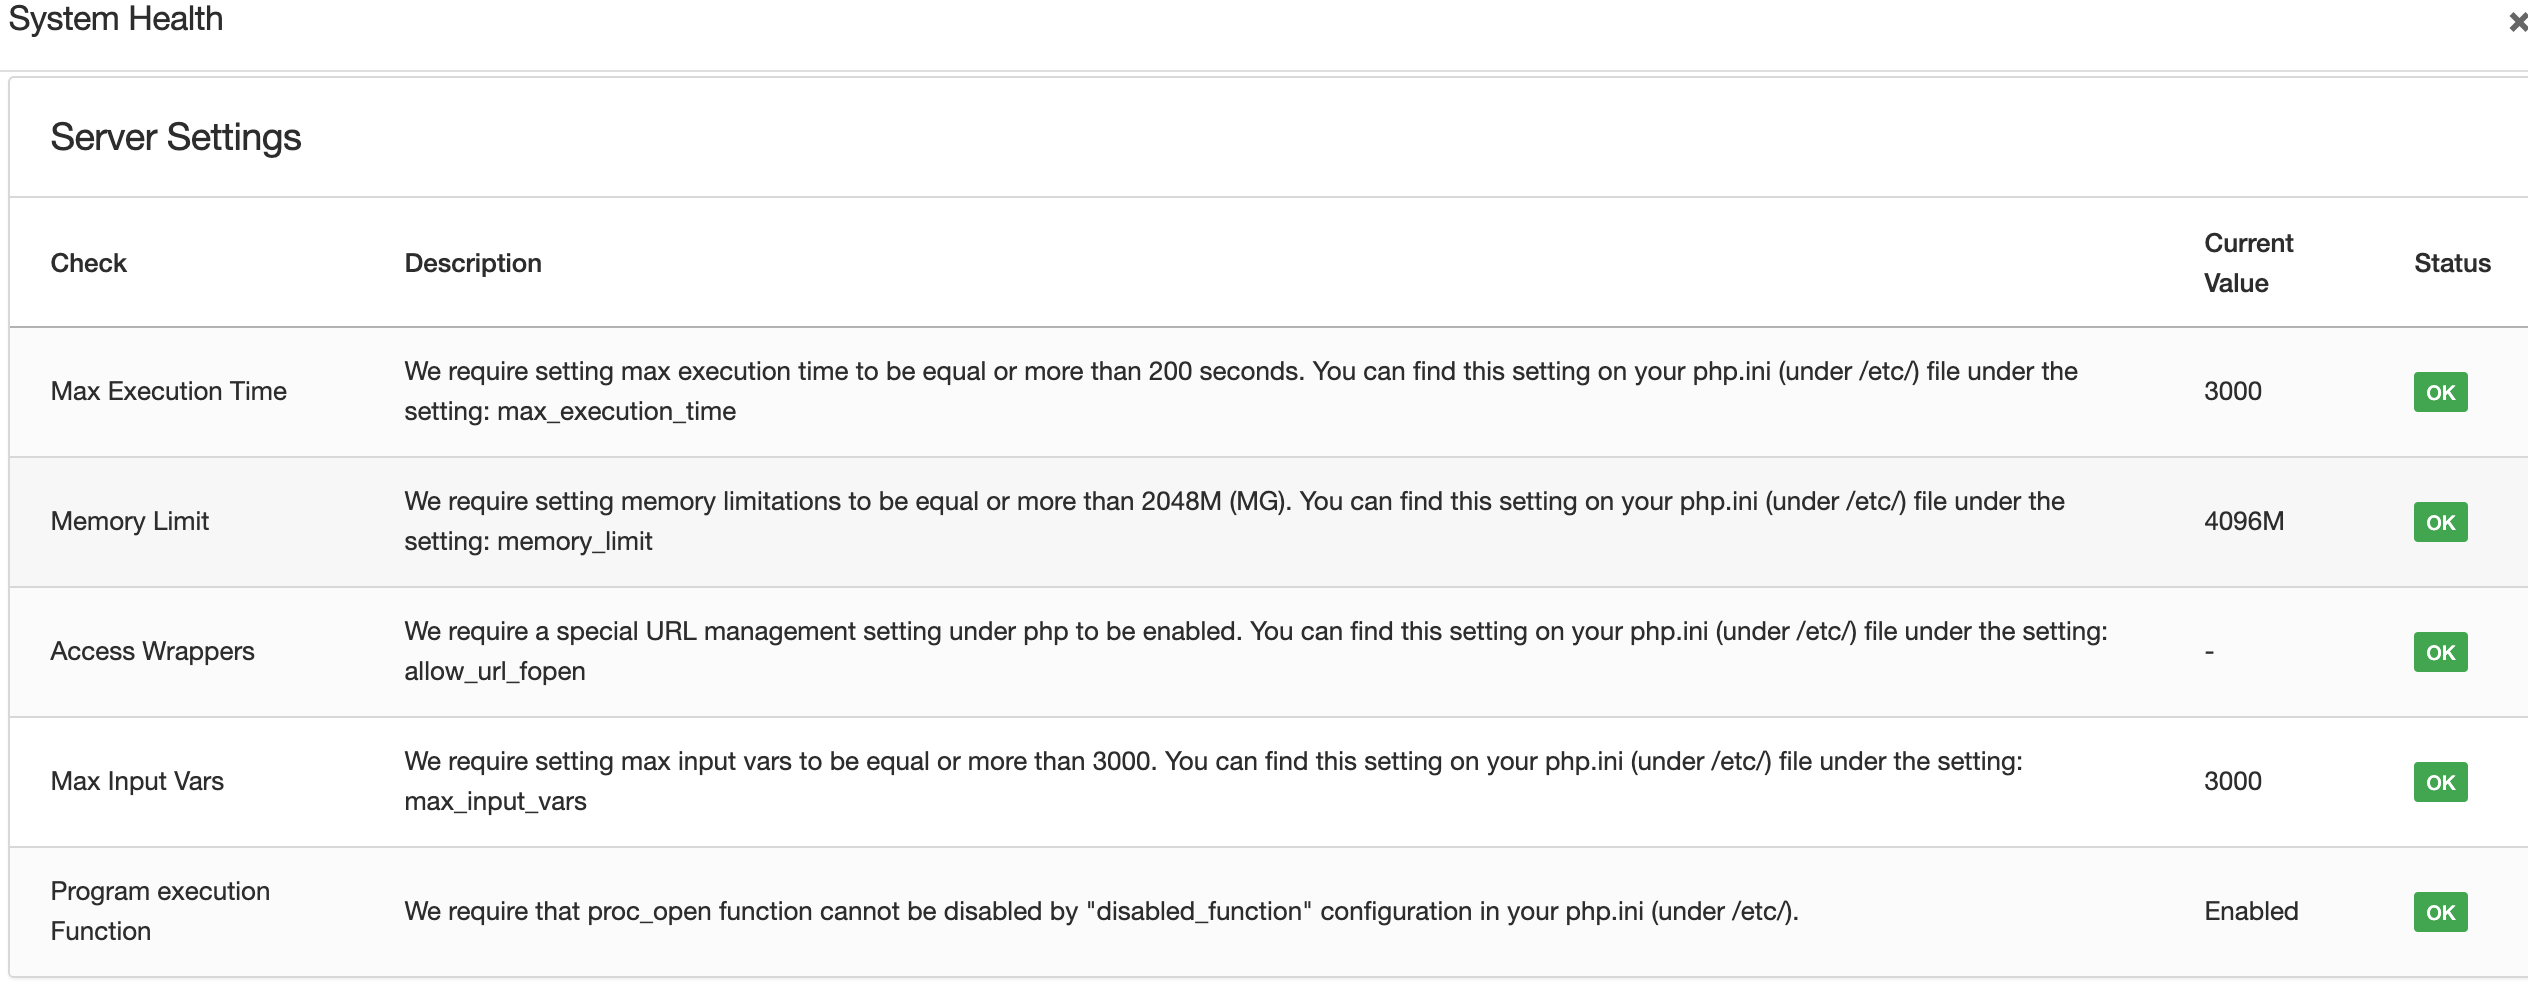
2/ Go to system / settings / system health and send a screenshot of this section:
3/ let us know if you are using a reverse proxy, if yes then let us know what time-out settings are being used
4/ follow the instructions below and send us the output of all commands
The following commands must be executed on every server involved on the eramba stack (db, web, etc). eramba must have dedicated servers, do not share those servers with other applications.
We need to know how many cores your system has, how fast they are and to a lesser extent what model
root@demo:~# cat /proc/cpuinfo
processor : 0
vendor_id : GenuineIntel
cpu family : 6
model : 79
model name : Intel(R) Xeon(R) CPU E5-2686 v4 @ 2.30GHz
stepping : 1
microcode : 0xb000038
cpu MHz : 2300.152
cache size : 46080 KB
physical id : 0
siblings : 2
core id : 0
cpu cores : 2
apicid : 0
initial apicid : 0
fpu : yes
fpu_exception : yes
cpuid level : 13
wp : yes
flags : fpu vme de pse tsc msr pae mce cx8 apic sep mtrr pge mca cmov pat pse36 clflush mmx fxsr sse sse2 ht syscall nx rdtscp lm constant_tsc rep_good nopl xtopology cpuid pni pclmulqdq ssse3 fma cx16 pcid sse4_1 sse4_2 x2apic movbe popcnt tsc_deadline_timer aes xsave avx f16c rdrand hypervisor lahf_lm abm cpuid_fault invpcid_single pti fsgsbase bmi1 avx2 smep bmi2 erms invpcid xsaveopt
bugs : cpu_meltdown spectre_v1 spectre_v2 spec_store_bypass l1tf mds swapgs itlb_multihit
bogomips : 4600.09
clflush size : 64
cache_alignment : 64
address sizes : 46 bits physical, 48 bits virtual
power management:
processor : 1
vendor_id : GenuineIntel
cpu family : 6
model : 79
model name : Intel(R) Xeon(R) CPU E5-2686 v4 @ 2.30GHz
stepping : 1
microcode : 0xb000038
cpu MHz : 2300.152
cache size : 46080 KB
physical id : 0
siblings : 2
core id : 1
cpu cores : 2
apicid : 2
initial apicid : 2
fpu : yes
fpu_exception : yes
cpuid level : 13
wp : yes
flags : fpu vme de pse tsc msr pae mce cx8 apic sep mtrr pge mca cmov pat pse36 clflush mmx fxsr sse sse2 ht syscall nx rdtscp lm constant_tsc rep_good nopl xtopology cpuid pni pclmulqdq ssse3 fma cx16 pcid sse4_1 sse4_2 x2apic movbe popcnt tsc_deadline_timer aes xsave avx f16c rdrand hypervisor lahf_lm abm cpuid_fault invpcid_single pti fsgsbase bmi1 avx2 smep bmi2 erms invpcid xsaveopt
bugs : cpu_meltdown spectre_v1 spectre_v2 spec_store_bypass l1tf mds swapgs itlb_multihit
bogomips : 4600.09
clflush size : 64
cache_alignment : 64
address sizes : 46 bits physical, 48 bits virtual
power management:
We need to know how much memory is available to the system and if SWAP is present or not
root@demo:~# free -m
total used free shared buff/cache available
Mem: 3943 1767 553 60 1622 1872
Swap: 2047 271 1776
We need to know how much disk space there is (for some commands that follow) and how your file system is distributed
root@demo:~# df -h
Filesystem Size Used Avail Use% Mounted on
udev 2.0G 0 2.0G 0% /dev
tmpfs 395M 816K 394M 1% /run
/dev/xvda1 20G 5.9G 14G 31% /
tmpfs 2.0G 0 2.0G 0% /dev/shm
tmpfs 5.0M 0 5.0M 0% /run/lock
tmpfs 2.0G 0 2.0G 0% /sys/fs/cgroup
/dev/loop1 18M 18M 0 100% /snap/amazon-ssm-agent/1480
/dev/xvdh 99G 16G 78G 17% /var/www
/dev/loop3 92M 92M 0 100% /snap/core/8592
/dev/loop0 92M 92M 0 100% /snap/core/8689
tmpfs 395M 0 395M 0% /run/user/33
tmpfs 395M 0 395M 0% /run/user/0
We need to know if your system is loaded (in reference to the number of cores and whatever is doing) without doing anything special
root@demo:~# uptime
13:11:29 up 26 days, 16:52, 1 user, load average: 0.36, 0.64, 0.51
YOU NEED MORE THAN 1GB OF SPACE FOR THE COMMANDS THAT COME NOW
We want to know how fast your system can write in a piece of the filesystem, depending how the system is mounted this command might give us a bad indication. We look in particular for write speeds (which most likely will be cached)
root@demo:~# sync; dd if=/dev/zero of=tempfile bs=1M count=1024; sync
1024+0 records in
1024+0 records out
1073741824 bytes (1.1 GB, 1.0 GiB) copied, 9.85937 s, 109 MB/s
Same but read, this will for sure be cached and the speed will be very high
root@demo:~# dd if=tempfile of=/dev/null bs=1M count=1024
1024+0 records in
1024+0 records out
1073741824 bytes (1.1 GB, 1.0 GiB) copied, 1.11766 s, 961 MB/s
We remove the cache for a second and try the same, the speed should be more realistic now
root@demo:~# sudo /sbin/sysctl -w vm.drop_caches=3 ; dd if=tempfile of=/dev/null bs=1M count=1024
vm.drop_caches = 3
1024+0 records in
1024+0 records out
1073741824 bytes (1.1 GB, 1.0 GiB) copied, 15.7841 s, 68.0 MB/s
root@demo:~# lsblk
NAME MAJ:MIN RM SIZE RO TYPE MOUNTPOINT
loop0 7:0 0 91.4M 1 loop /snap/core/8689
loop1 7:1 0 18M 1 loop /snap/amazon-ssm-agent/1480
loop3 7:3 0 91.3M 1 loop /snap/core/8592
xvda 202:0 0 20G 0 disk
└─xvda1 202:1 0 20G 0 part /
xvdh 202:112 0 100G 0 disk /var/www
root@demo:~#
IMPORTANT: the “xvda1” string on the command below must be ADJUSTED to your system. Look at the command above and pick the right value based on where your eramba is installed. In our case is “xvda1” because eramba is installed somewhere inside the / directory.
We measure the same as above but this time with hdparm to have a second “opinion”, numbers should be similar as above
root@demo:~# hdparm -Tt /dev/xvda1
/dev/xvda1:
Timing cached reads: 18008 MB in 1.99 seconds = 9052.69 MB/sec
Timing buffered disk reads: 244 MB in 3.00 seconds = 81.33 MB/sec