How to Connect and Create Reports from eramba Enterprise Using Power BI
Introduction
In this guide, we will walk you through the steps of connecting Power BI to the eramba Enterprise database and creating dynamic reports. This is the first part of our series on using BI tools with Eramba. We will use Power BI Desktop for this tutorial. If there’s a specific tool you’d like us to cover, feel free to let us know!
Note: This guide is intended for the Enterprise On-Prem version of Eramba running on Docker. Guidelines for VMware and SaaS versions will be provided later.
Prerequisites
- Eramba: Make sure you have access to your eramba instance and appropriate permissions to access the database.
- Power BI Desktop: Download and install the latest version from Microsoft’s Power BI site.
- MySQL Connector: You need to install the Oracle MySQL Connector/NET package prior to using this connector in Power BI Desktop.
- Database Access: Ensure you have the necessary credentials and firewall settings to connect to the eramba database.
Step 1: Connecting Power BI to Eramba
- Open Power BI Desktop: Launch the application on your computer.
- Get Data:
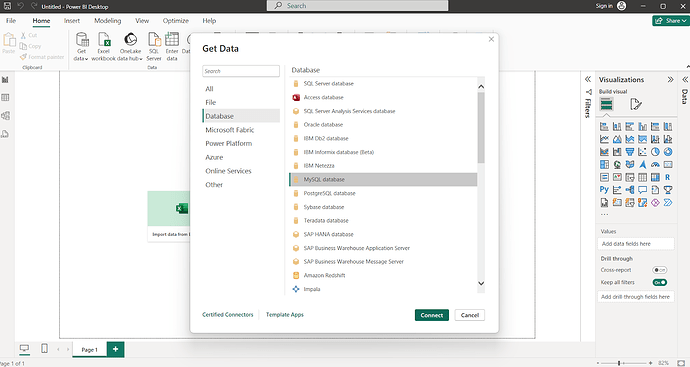
- Click on the “Home” tab and select “Get Data.”
- Choose the appropriate database type (MySQL).
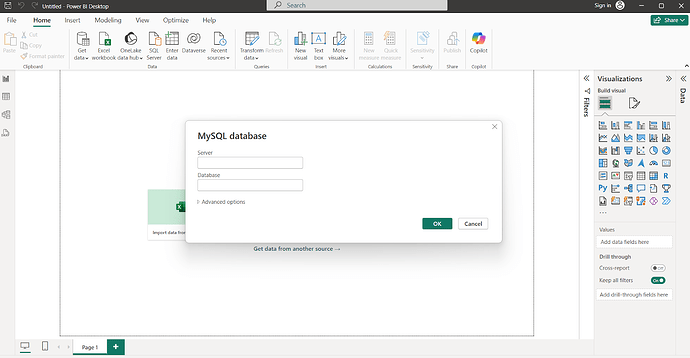
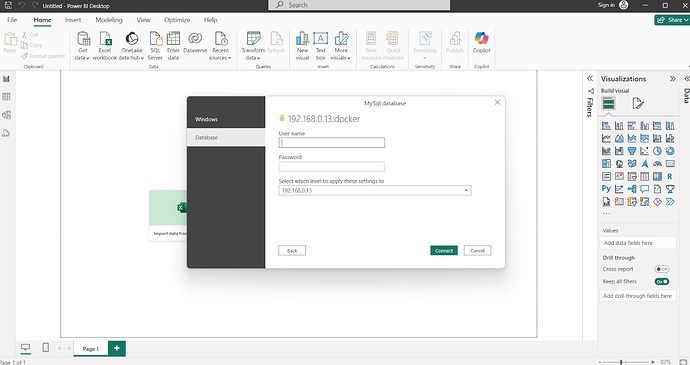
- Input the server name or the IP/URL, database name (docker), and your credentials.
- Click “OK” to establish the connection.
- Select Data Tables:
-
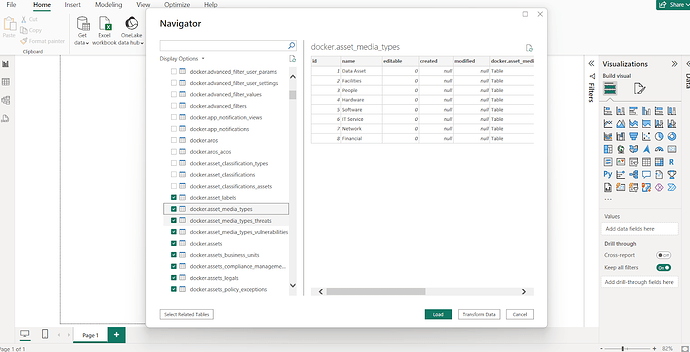
Once connected, a Navigator window will pop up displaying the available tables in the eramba database.
-
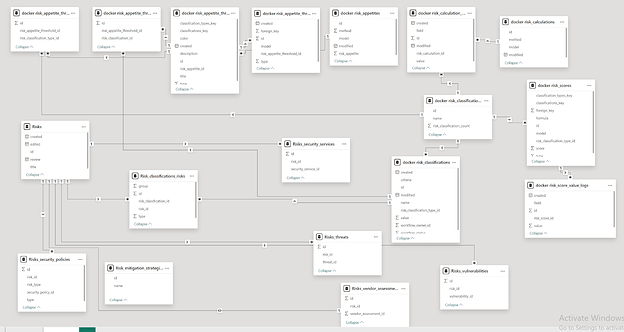
Select the relevant tables that contain the data you want to report on (e.g., security_policy, security_service, risk_classification, docker_compliance_packages etc.).
-
Click “Load” to bring this data into Power BI.
Step 2: Creating Your First Report
- Data Preparation:
- Before creating visuals, you may need to clean or transform the data. Use Power BI’s “Power Query Editor” to perform tasks like filtering rows, merging tables, or creating calculated columns.
- Creating Visuals:
- Use the “Report” view in Power BI to start building your dashboard.
- Drag and drop fields from the right panel to create charts, tables, and other visuals.
- For example, to create a report on “Compliance by Treatment”:
- Drag the name field from the docker_compliance_packages table to the axis of a bar chart.
- Drag the count fields from the security_policy and security_service tables to the value section.
- Adding Filters and Slicers:
- To make your reports more interactive, add slicers to allow users to filter data dynamically.
- For example, you can add a slicer based on the year field to filter reports by specific years.
- Designing the Dashboard:
- Arrange your visuals in a way that tells a cohesive story.
- Customize colors, fonts, and layouts to enhance readability and visual appeal.
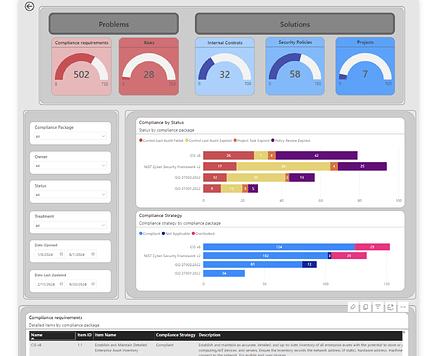
- This is an example:
Step 3: Publishing and Sharing Reports
- Publish to Power BI Service:
- Once your report is ready, click on “Publish” from the Home tab.
- Choose your workspace and click “Select.”
- Your report will be uploaded to the Power BI Service, where it can be accessed online.
- Sharing with Others:
- In the Power BI Service, you can share your report with others by generating a shareable link or embedding the report in websites or other applications.
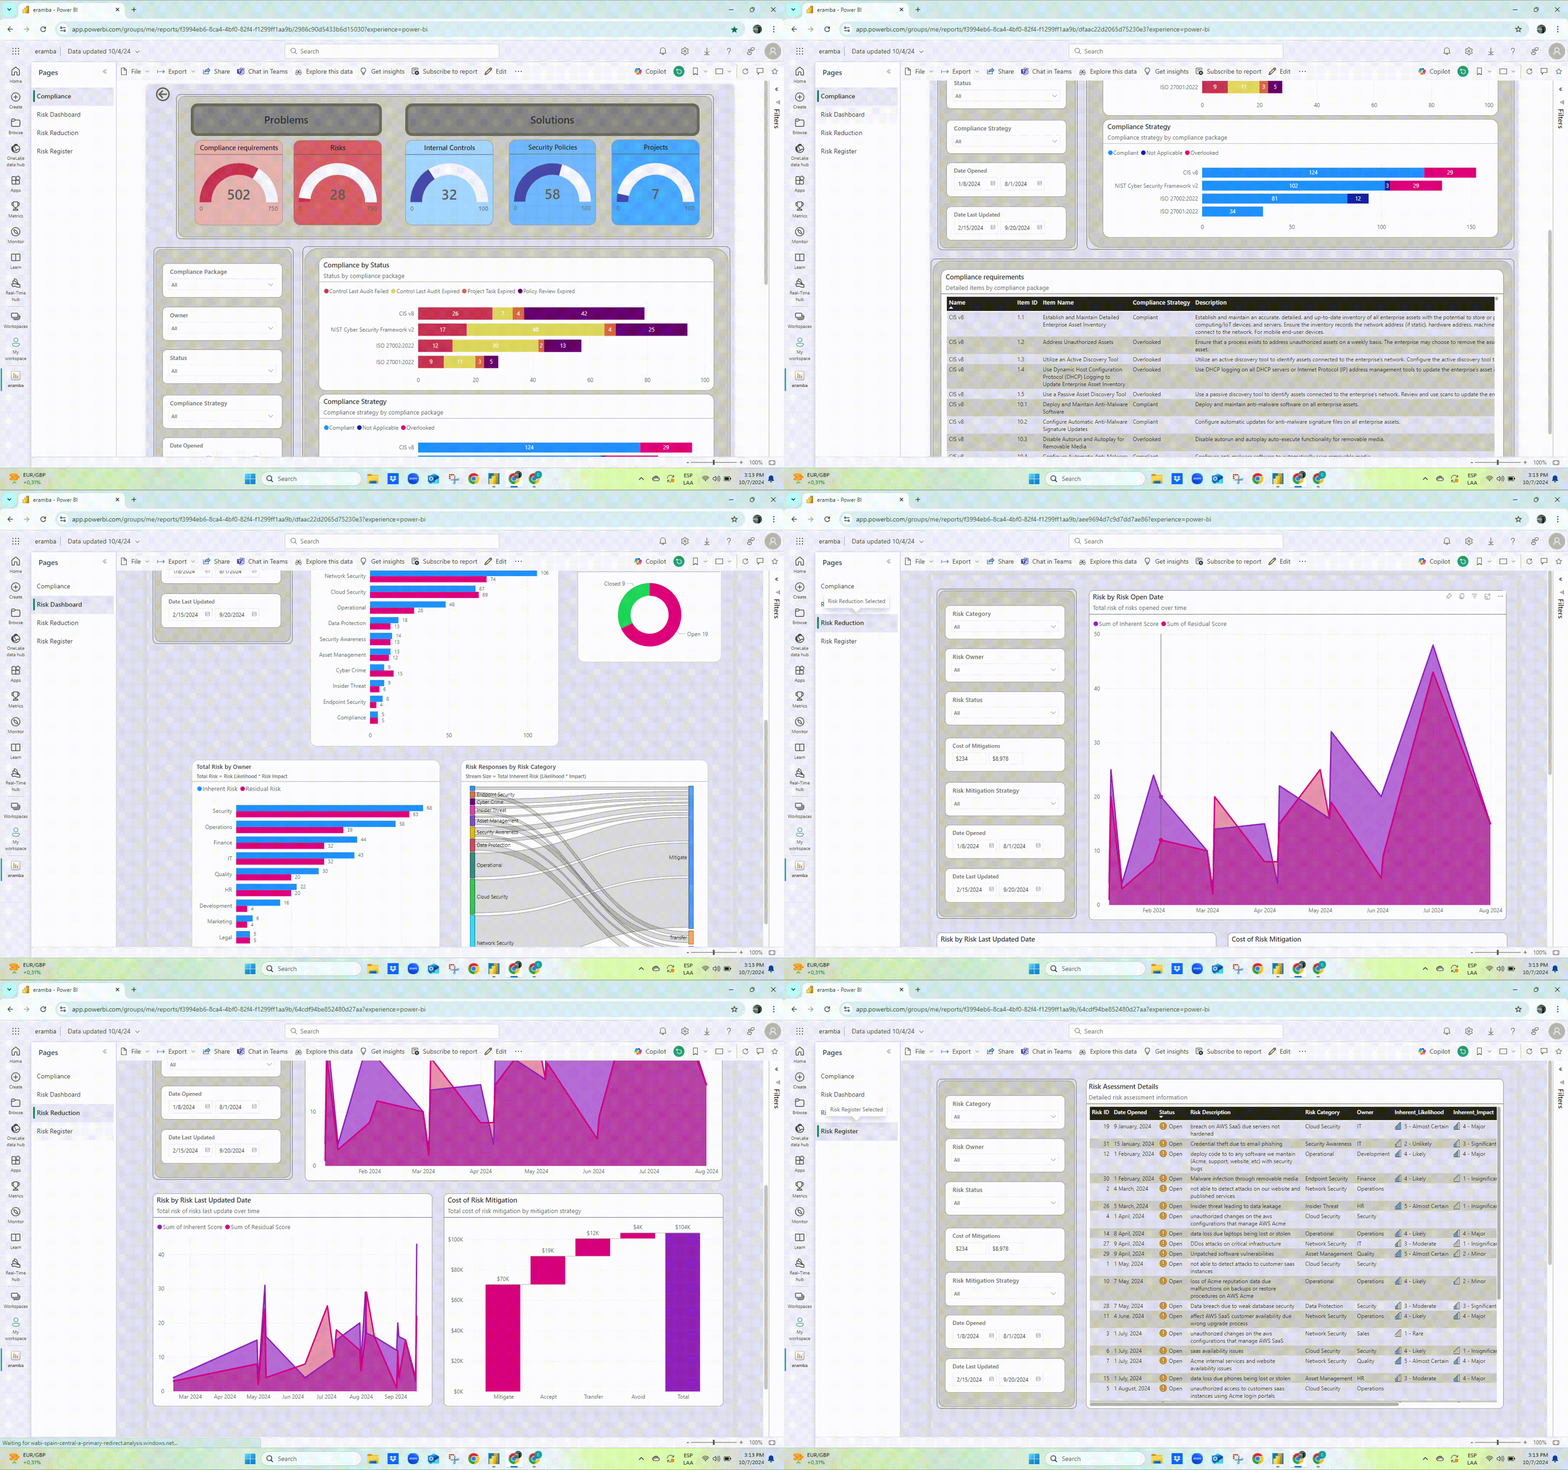
Step 4: Voila! Maximizing the Value of the Reports
Conclusion
By following these steps, you can create powerful, data-driven reports from eramba using Power BI. This allows you to gain deeper insights into your organization’s compliance status, risk assessments, and more. Stay tuned for the next part of this series, where we will explore connecting eramba with other BI tools.
