In this post I’ll share some support metrics for 2023:
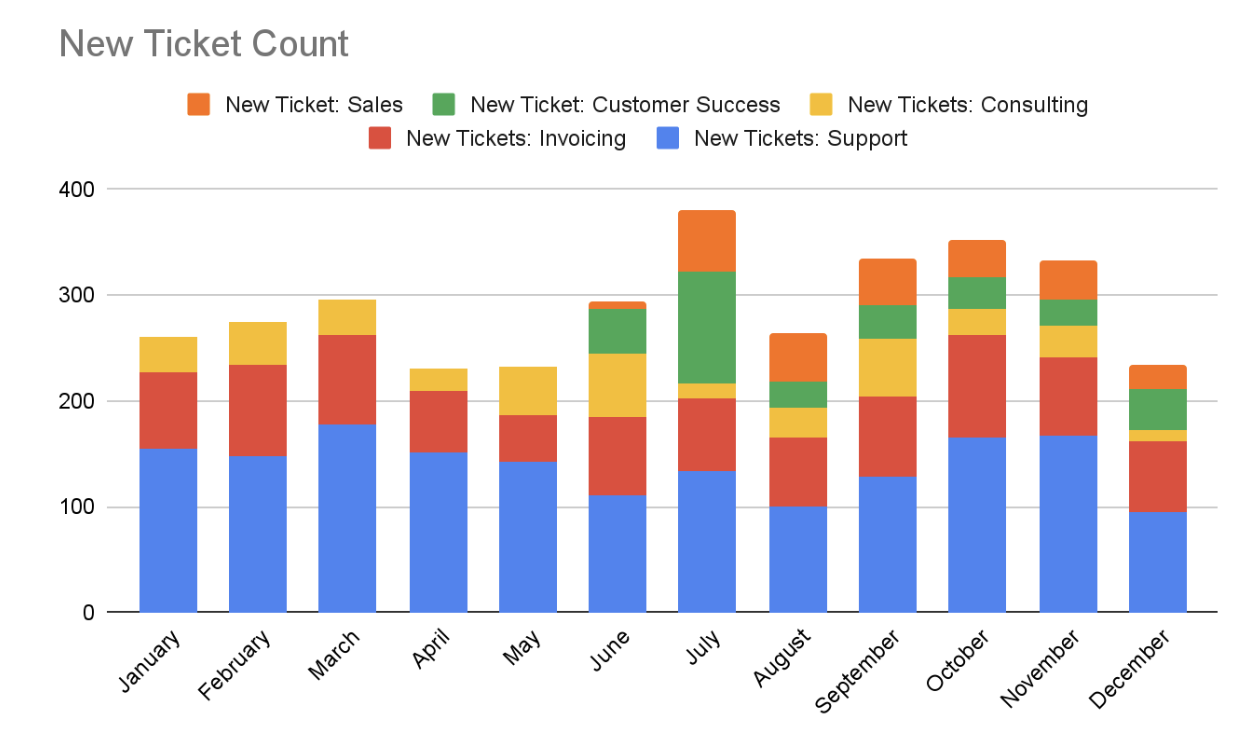
- This looks at the number of customer interactions, per type, per month.
- The trend is fairly stable over the year, we focus in particular on tech-support (blue)
- H1-2023, the average tech-support ticket per month is 260, in H2-2023 goes down to 200
- If you consider that the number of customers grew by %20-30 from Jan to December, the ratio of customers/tickets therefore decreased a lot more in H2-2023
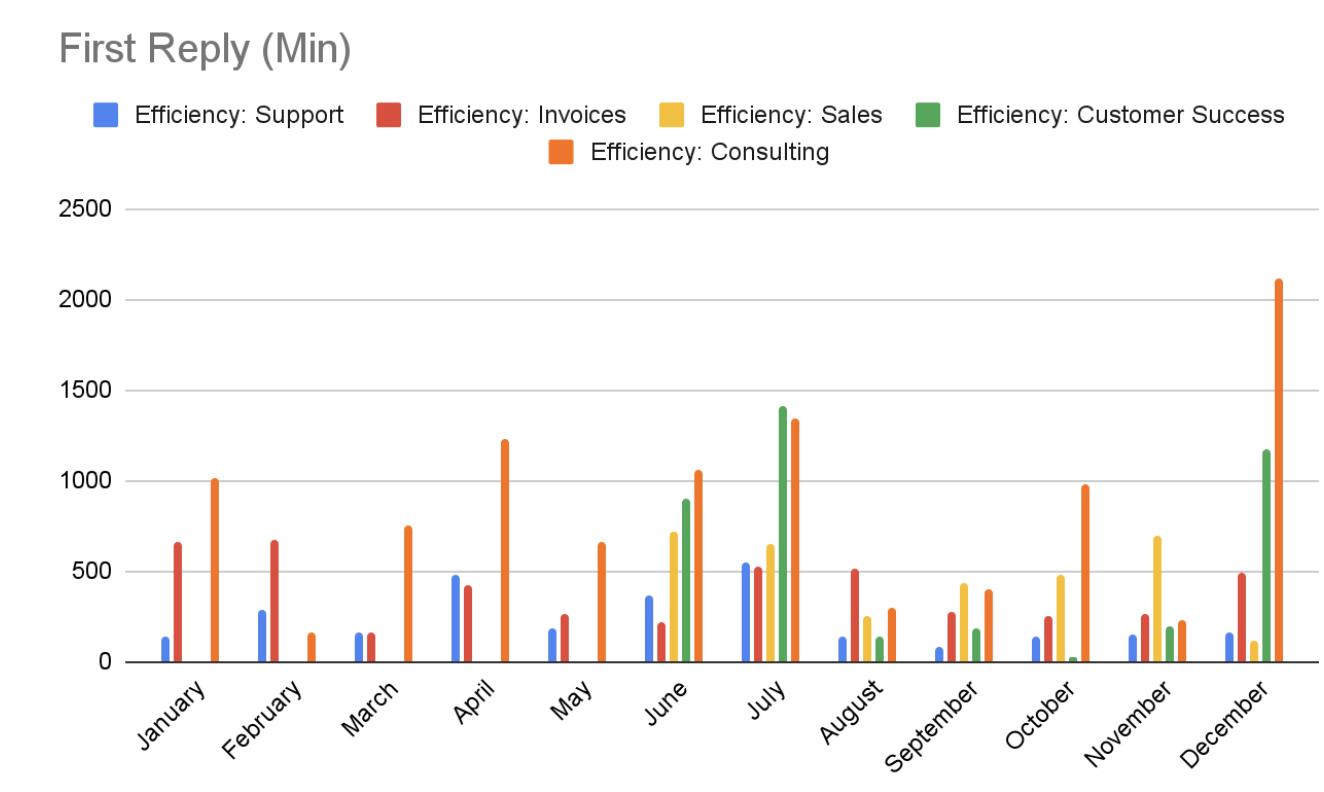
- This chart looks at the number of minutes it takes us to respond your tickets. Bear in mind we work Monday-Friday, 8-5pm CET. If you write from Los Angeles at their 3pm local time, the ticket will be waiting on our queue 8 hours (480 minutes).
- Summer months and December are always slower for everything except tech-support.
- Tech-support in H1-2023 had an average of 250 minutes, while in H2-2023 went down to 130.
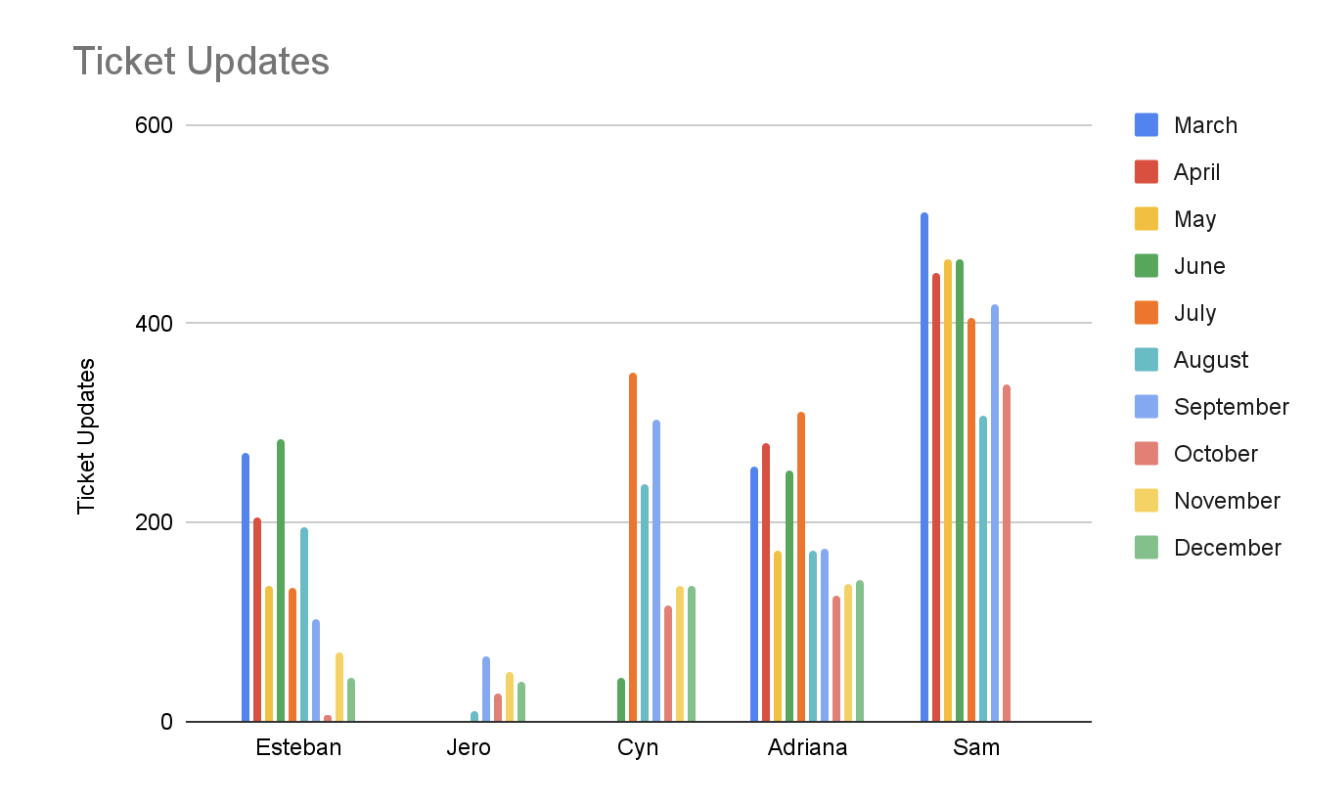
- This is the number of tickets that each person on the team (that handles custmers) dealt with
- Focusing on Sam, the number of tickets is clearly downwards despite the increase on absolute number of customers from January to December