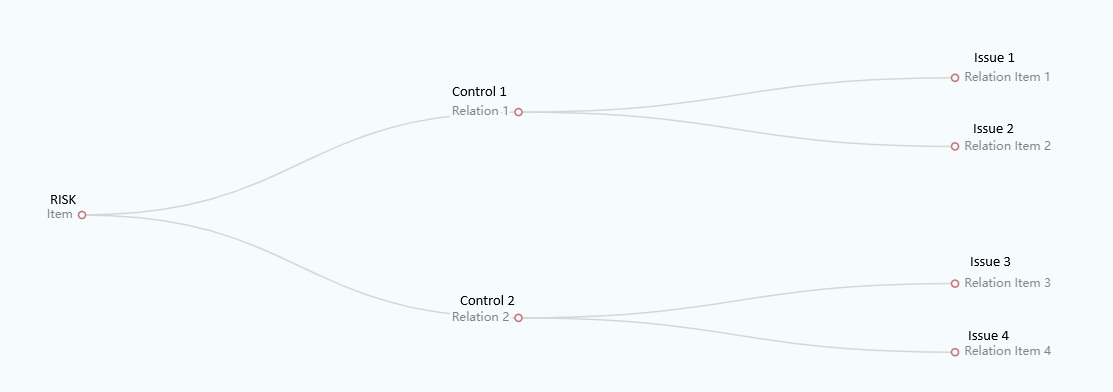
Hi All, at present it is possible to see which control issues are impacting risks, but this is a manual step via the interface to trace it back to the partcular issue (by clicking through). I am looking to create a report/fiter/table or similar (see image) which can show a risk and all the associated issues - possibly similar to the usual ‘relationship’ chart. At present it is possible to see which controls are associated with a risk using that chart but I cant seem to see a way to add the control issues in addition? I appreciate the charts are hard coded and this will be unlikely, however is there a way of doing it via filters or other similar functionality? The image shows the chart (excuse my amature mockup! ![]() ) which shows graphically what i would like to achieve, however if there is another format anyone can suggest that would be much appreciated.
) which shows graphically what i would like to achieve, however if there is another format anyone can suggest that would be much appreciated.